In this article, we will look at GCP monitoring. We will discuss what Google Cloud's operations suite (formerly known as Stackdriver) is and why you need it. We will explain all of the services that it offers. We will also go through some basic configurations that will give you a good understanding of how you can leverage it in order to monitor your Google Cloud services, such as Google Compute Engine (GCE) or Google Kubernetes Engine (GKE).
The following topics will be covered in this article:
- Introduction to Google Cloud's operations suite
- Configuring Google Cloud's operations suite
- Cloud Monitoring
- Cloud Logging
- Application Performance Management (APM)
Exam Tips
Monitoring is a massive topic and can feel somewhat overwhelming. Once you understand the three main functionalities of Google Cloud's operations suite, which are monitoring, logging, and APM, we want you to focus on what you will be tested on in the exam. Make sure that you know which GCP services you can monitor with Google Cloud's operations suite. Pay special attention to GCE, both in terms of performance and availability monitoring. Understand audit logs well, and make sure that you know how to track who made the changes to your project and the associated resources. Log in to the GCP console and browse the activity and audit logs. Anticipate that you may be asked about where to find particular types of logs! Finally, Qwiklabs will allow you to understand the service better, and we strongly recommend that you have a look at the available labs.
Technical requirements
In order to gain hands-on experience with Google Cloud's operations suite, we recommend that you use Qwiklabs. The Google Cloud operations suite quest can be found here: https://www.qwiklabs.com/quests/35?locale=en.
Important Note
You need to purchase credits in order to enroll for the quest.
Introduction to Google Cloud's operations suite
We have already learned about a number of services, and now it is time to take a closer look at the monitoring options. Google comes with a GCP-integrated tool called Google Cloud's operations suite (formerly known as Stackdriver). Stackdriver was founded in 2012 as a Software-as-a-Service (SaaS) platform that would allow consistent monitoring across different cloud layers. In 2014, it was acquired by Google and made publicly available in 2016 as a GCP service.
Currently, Google Cloud's operations suite can monitor both GCP and AWS. However, integration with the former is much more robust. Google Cloud's operations suite is a set of tools that provides the following services:
- Monitoring
- Logging
- Debugging
- Tracing
- Error Reporting
- Profiling
Monitoring and Logging are agentless, but in order to obtain more informative metrics and logs, an agent should be installed. There are actually two types of agents that can be installed on your instances: a Monitoring agent, based on the collectd software, and a Logging agent, based on the fluentd software.
In the following diagram, you can see a schema, which highlights a GCE VM instance and the agents that are installed on top of it. The VM instance, by default, talks to Logging and Monitoring. The agents report to their respective services:
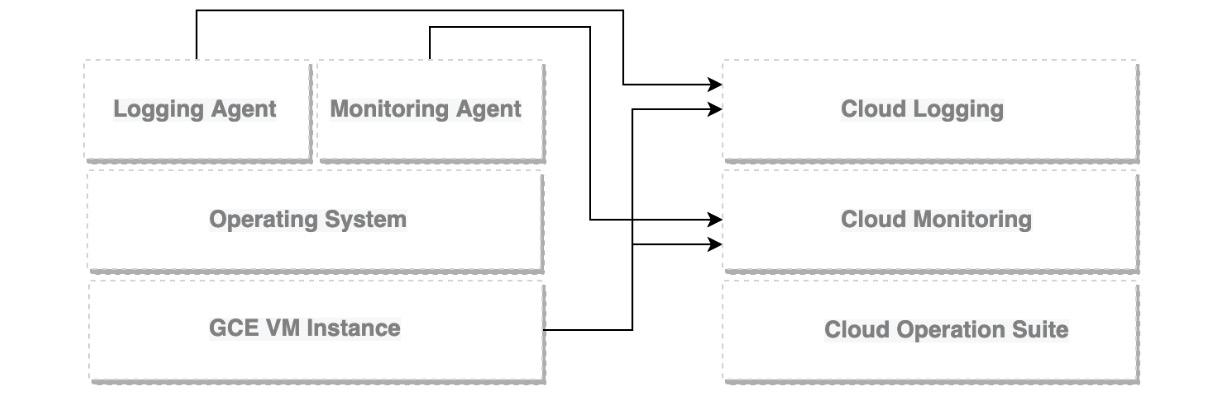
Figure 17.1 – Google Cloud's operations suite
GCP is a developer-oriented platform, and it provides a lot of monitoring-related services that can be directly integrated with your application. Google Cloud's operations suite allows you to monitor both the infrastructure and the applications. It is very important to understand that developers need to consider monitoring and logging from the very outset when designing applications. For each of the programming languages that are supported, there are libraries that facilitate log integration with Google Cloud's operations suite. Make sure that you check out the languages that are supported so that you can take full advantage of them!
In this article, we will have a look at how Google Cloud's operations suite is used to monitor GCP. Remember to read this article carefully and perform the recommended Qwiklabs, as this is a key exam topic.
Now that we have a basic understanding of what Google Cloud's operations suite is, let's have a look at the cost of each service.
Cost
With Google Cloud's operations suite, you only pay for what you use. The cost can be controlled using Cloud Billing reports and alerts.
The following Google Cloud operations suite services can be used for free:
- Cloud Debugger
- Error Reporting
- Cloud Profiler
The following services may incur costs once monthly limits have been exceeded:
- Cloud Logging
- Cloud Monitoring
- Cloud Trace
We don't include the actual prices on purpose, given that they may change.
Important Note
Check the following link to learn about the most recent and detailed pricing list: https://cloud.google.com/monitoring#pricing.
Configuring Google Cloud's operations suite
Exam Tip
For Stackdriver, there was a need to manually create a monitoring workspace. After Google Cloud's operations suite was introduced, there was no more need to do it. When you navigate to Cloud Monitoring from the Google Console, you will see the project has been enabled for monitoring automatically after it was created and has become a so-called scoping project.
Google Cloud's operations suite is enabled on a project-by-project basis. Best practice says that if you are going to use just one project, you should enable it for that project. If you have more than one project, you should have a separate project just for monitoring. This is called a scoping project. From that project, you will be able to indicate which other projects you would like to monitor. Those will become monitored projects. Remember, you are not charged for additional projects, so this will not entail any additional costs.
Now, let's have a look at how to start working with Google Cloud's operations suite:
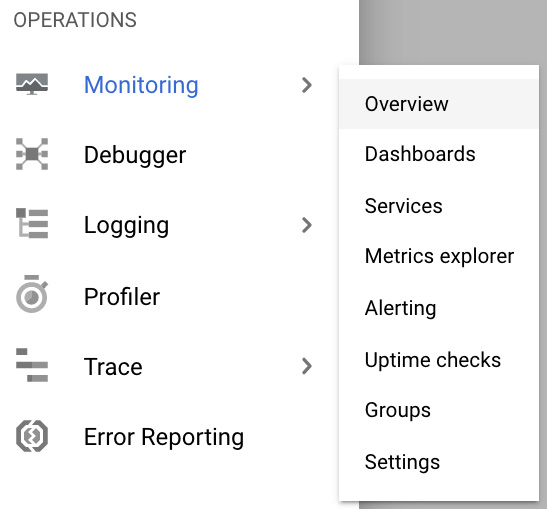
- From the hamburger menu, go to Monitoring. Next, choose Overview:

Figure 17.2 – Access Cloud Monitoring
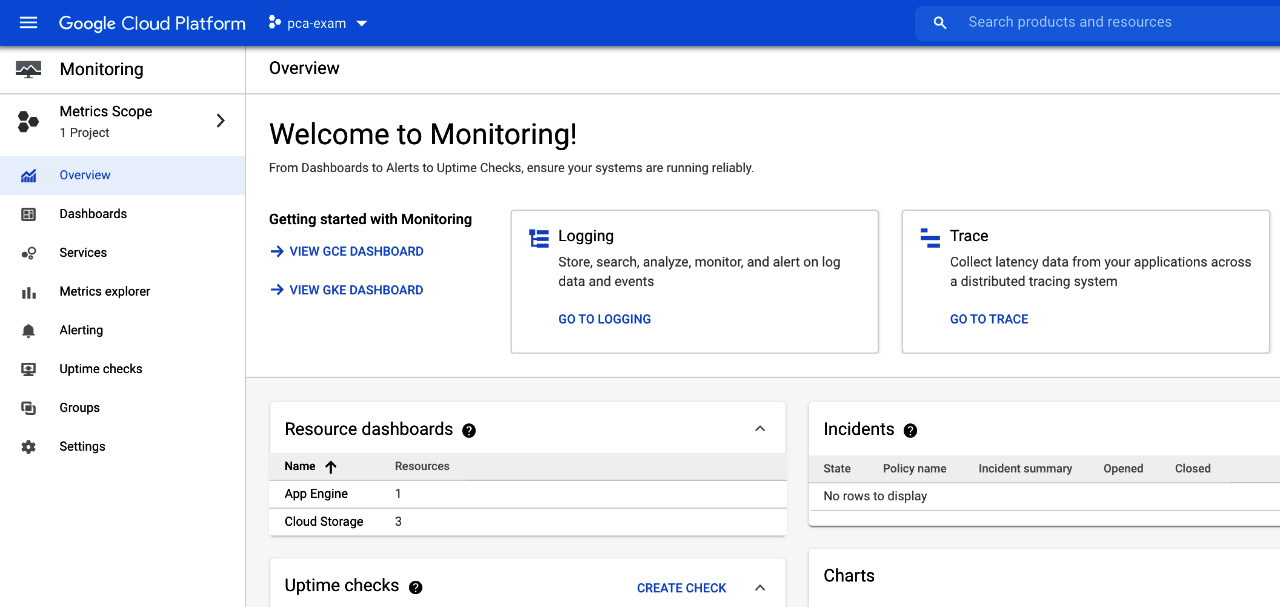
- This brings you to the Cloud Monitoring main screen. As you can see, you have a well-formatted board that sums up the most important information related to your GCP resource monitoring, such as resource Dashboards, incident Uptime checks, and so on:

Figure 17.3 – Cloud Monitoring Overview screen
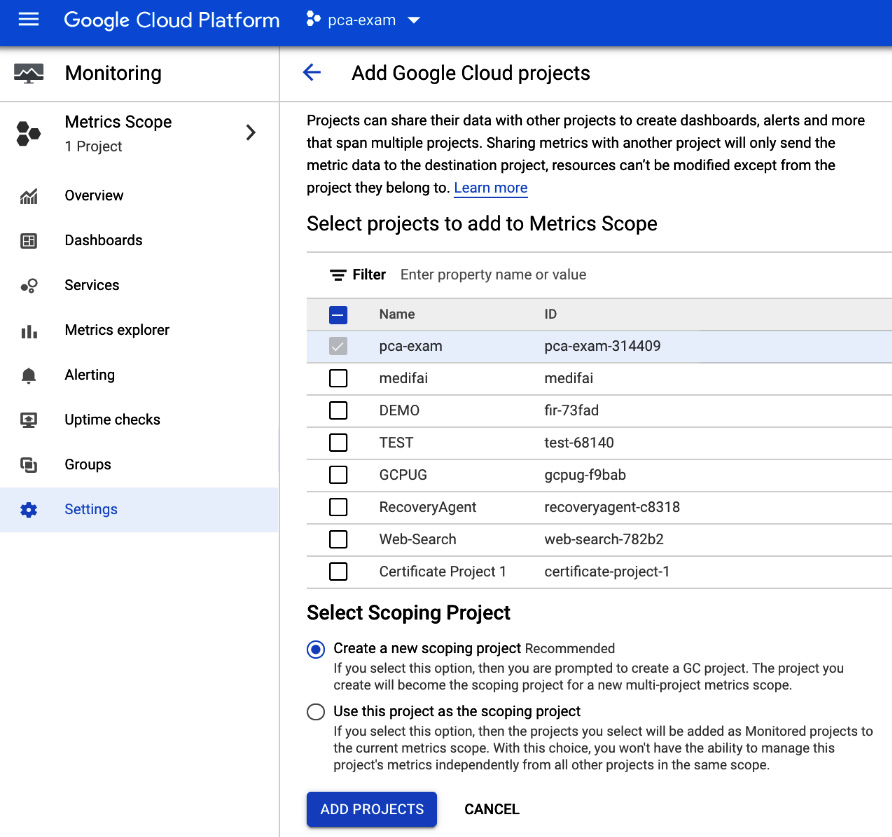
- In the scenario of multiple projects, enable monitoring for each project by clicking on Metrics Scope in the left pane and then on the Add Cloud projects to metrics scope link (https://console.cloud.google.com/monitoring/settings/add-projects?project=pca-exam-314409):

Figure 17.4 – Add Google Cloud projects
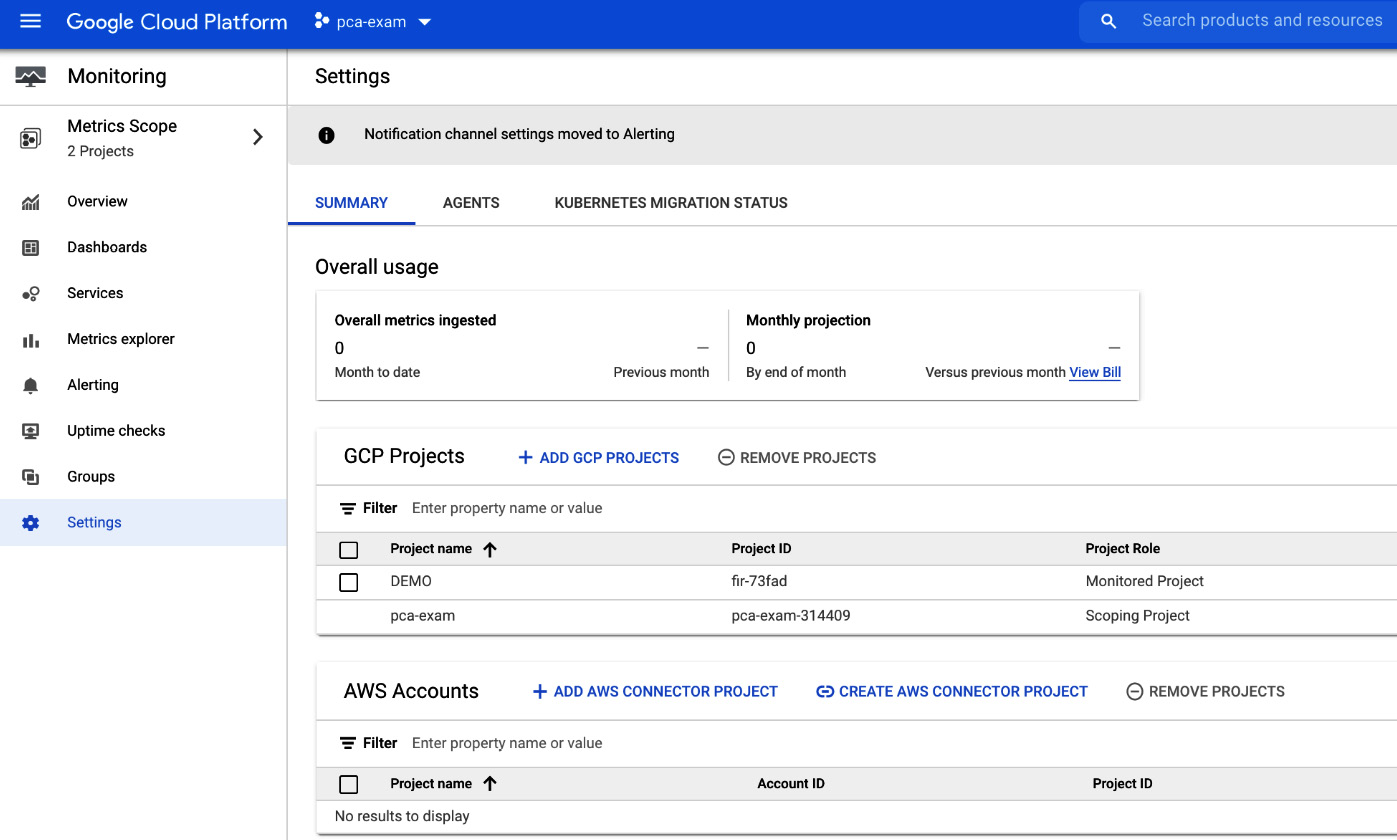
Now we can see the metrics scope settings with our projects. You can either add the project to be monitored by the current scoping project or create a new scoping project. When you are ready with selecting the projects, click on the ADD PROJECTS button:

Figure 17.5 – Metrics Scope – Settings
- You can choose whether you want to monitor AWS resources. That will require the creation of an IAM role in AWS, with listed permissions. If you only work with GCP, then you can launch monitoring by clicking on Skip AWS Setup.
Exam Tip
Google Cloud operations suite is also capable of monitoring logging data for your AWS accounts. You must associate your AWS resources with a Google Cloud project. This project serves as a connector to AWS.
Now that we have configured Google Cloud's operations suite, let's look at the monitoring service.
Cloud Monitoring
With the Monitoring service, you can discover and monitor all GCP resources and services. The Monitoring console allows you to view all of your resources, create alerting policies, and view uptime checks, groups, and custom dashboards. It also allows you to navigate to the debug, trace, logging, and error reporting consoles.
Let's have a look at what can be configured from here. We will look into the following topics:
- Groups
- Dashboards
- Alerting policies
- Change screen
- Uptime checks
- Monitoring agents
Groups
Resources such as VM instances, applications, and databases can be grouped into logical groups. This allows us to manage them together and display them in dashboards. Constraints are used to define the criteria to filter the resources. They can be based on names, regions, applications, and so on. The groups can be nested in one another, and the nesting can be six levels deep:
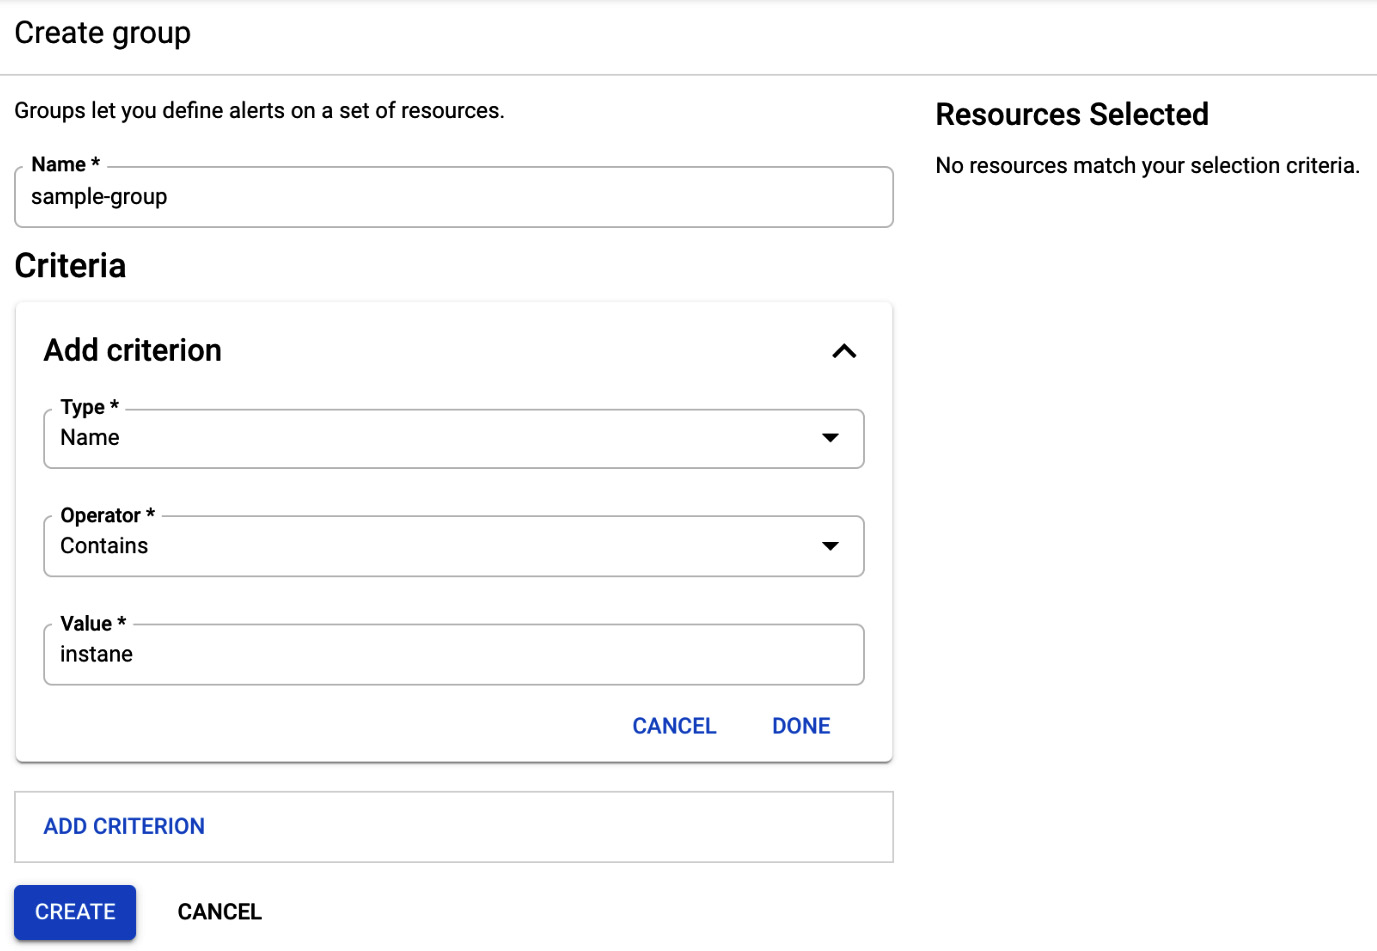
Figure 17.6 – Create group
The preceding screenshot shows the screen for creating a new group. We can use multiple criteria to filter the resources that we want to be added to the group.
Dashboards
Dashboards allow us to give visibility to different metrics in a single pane of glass. We can create multiple dashboards that contain charts based on predefined or user-defined metrics. This allows us to create customized boards with the most important metrics. The charts visualize the metrics, allowing a good understanding of how your environment performs.
Note that, for VM instances, we can also see agent-based metrics on top of standard metrics. The agent-based metrics will be listed when you go to Dashboards and click on the +CREATE DASHBOARD button. Next, choose one of the charts from the library and click on the Metric dropdown:
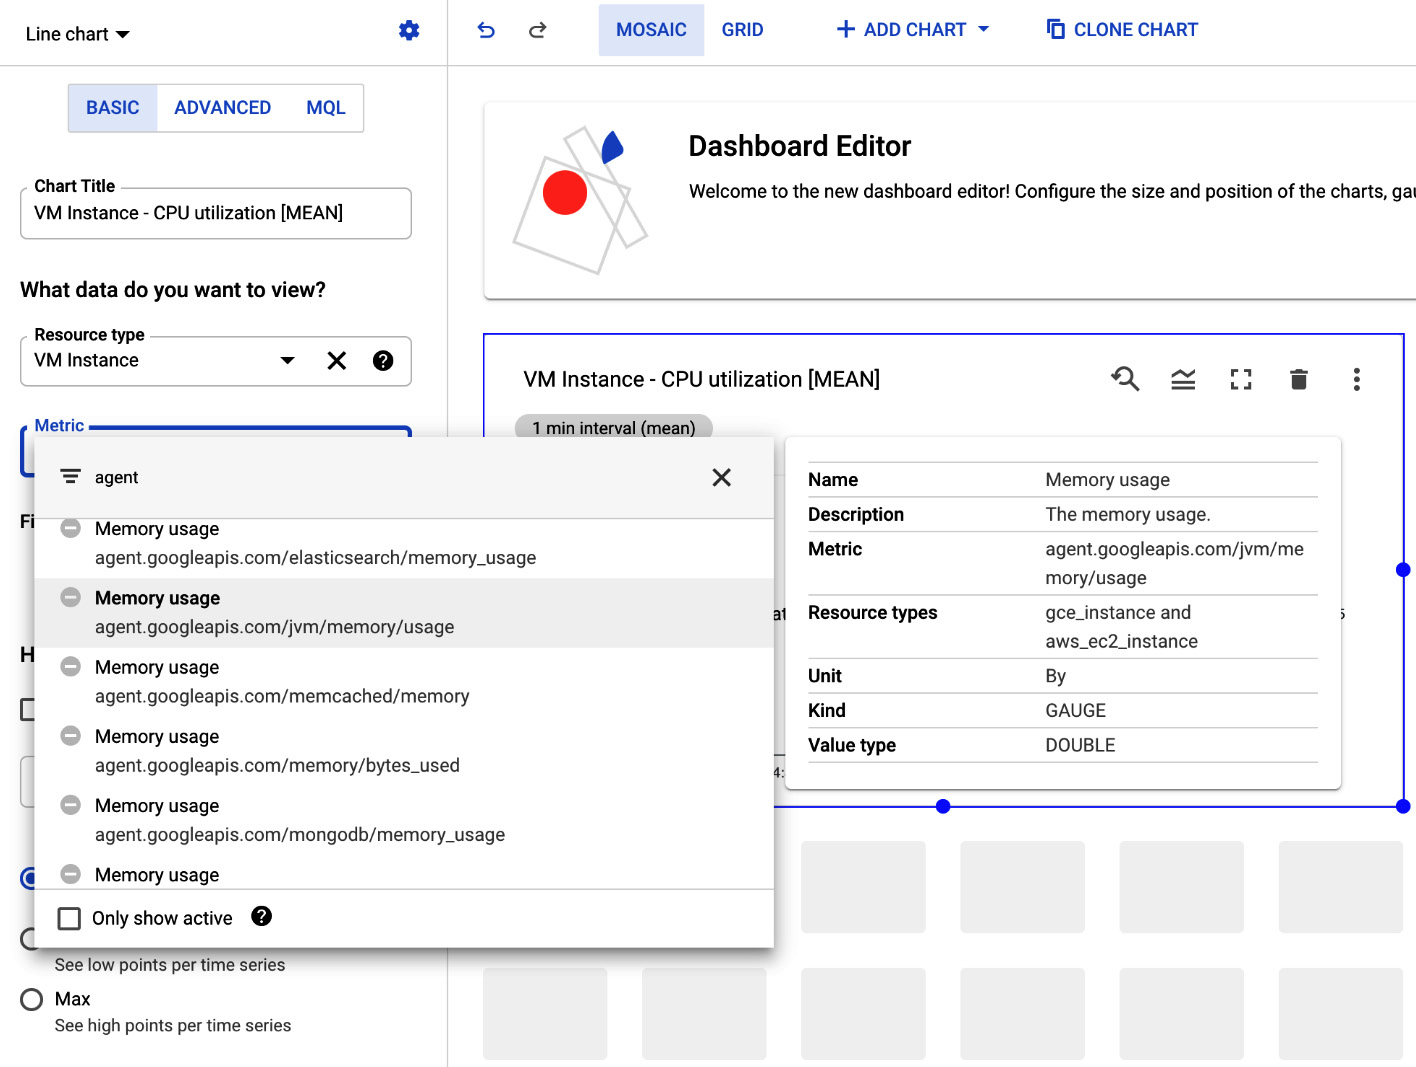
Figure 17.7 – Dashboards
Alerting policies
Alerting policies can be configured in order to create notifications when event and metric thresholds are reached. The policies can have one or more conditions to trigger the alert and will create an incident that is visible in the Cloud Monitoring console.
The following actions can be selected to address the open incident:
- Acknowledge
- Silence Associated condition
- View Policy
- Edit Alerting Policy
The menu for these actions opens once you click on the three-dots icon in the right-hand corner:
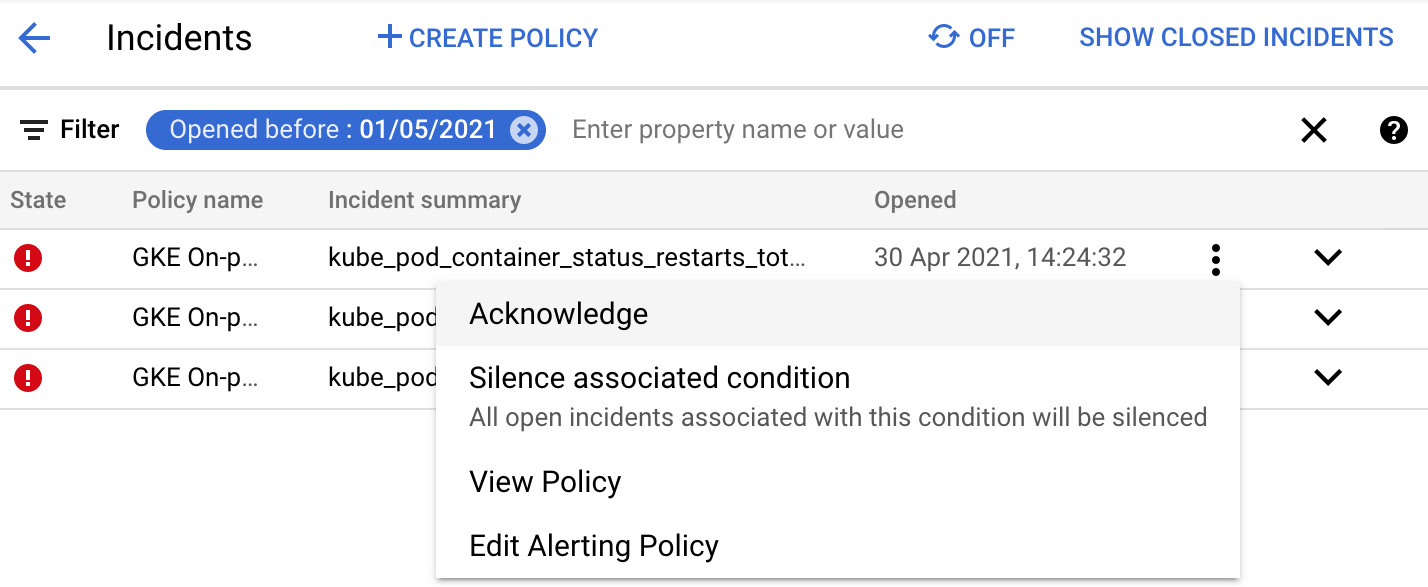
Figure 17.8 – Alerting policies
The incident can be acknowledged as a known issue or resolved. In terms of notifications, email, SMS, and many other forms can be configured. The channel to be used can be chosen from the drop-down menu, as shown in the following screenshot:
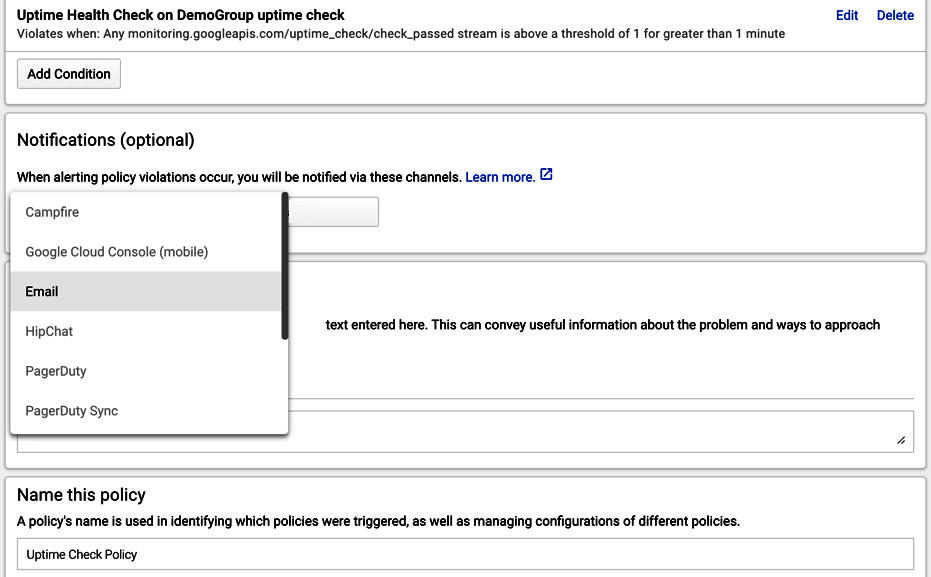
Figure 17.9 – Notifications
To further guide the operations to a possible solution, documentation links can also be attached to the alert.
Uptime checks
Uptime checks are used for checking the availability of your services from different locations around the globe. They can be combined with alerting policies and are displayed in the dashboards. Checks can be done using HTTP, HTTPS, or TCP, and are possible for URLs, App Engine, Elastic Load Balancing (ELB), Kubernetes' load balancer service, and Amazon EC2 and GCE instances. The probing interval can be set to 1, 5, 10, or 15 minutes:
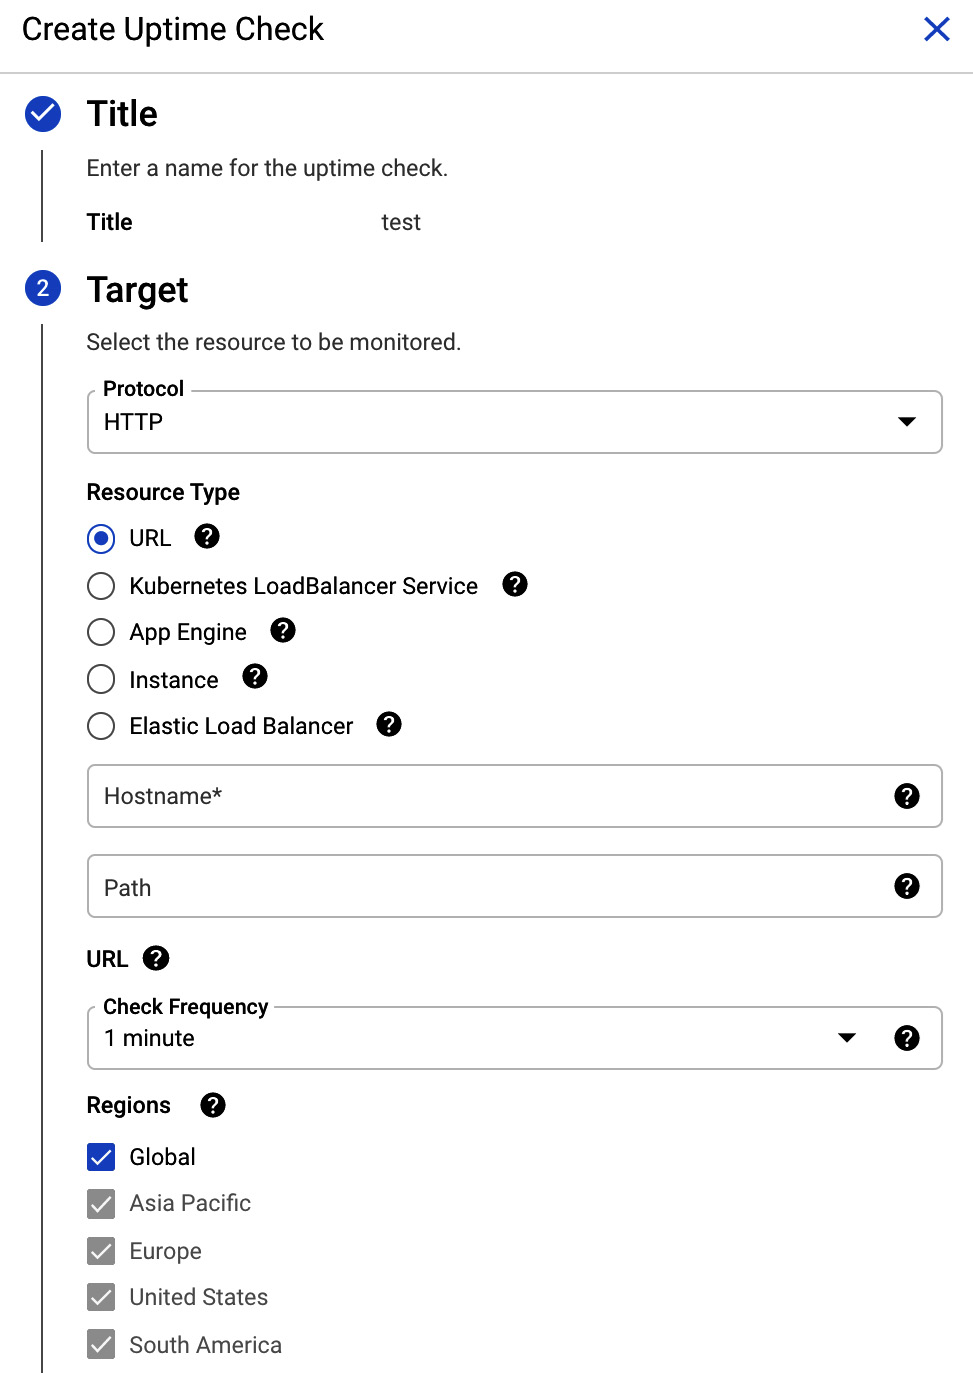
Figure 17.10 – Uptime check
You also need to choose from which regions the checks will be performed. You need to have at least three regions checked:

Figure 17.11 – Regions
In the further section, you can add the host header, change the port, add custom headers, and encrypt them. You can also add authentication if applicable:
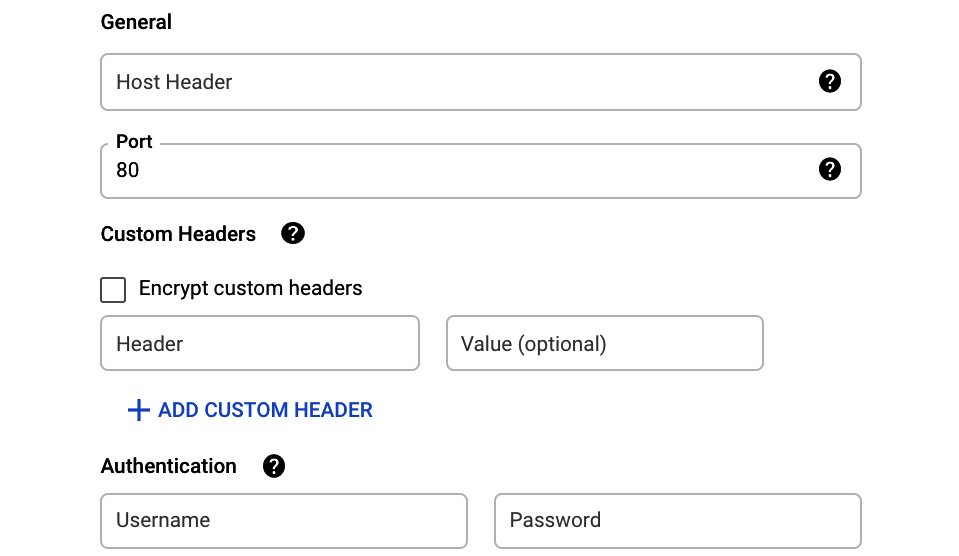
Figure 17.12 – Advanced settings
In the Response Validation section, you can set Response Timeout and set up the content matching for the response:
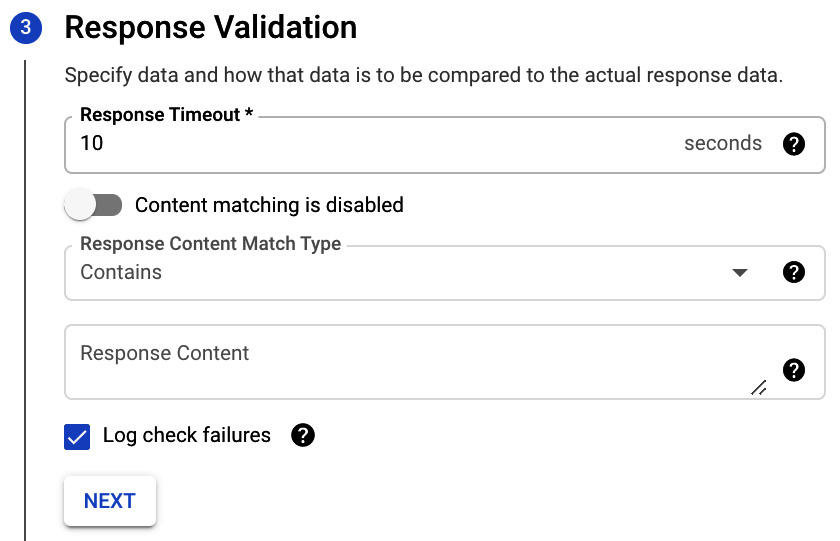
Figure 17.13 – Response Validation
Finally, you can set up alerts and notifications. You can choose which notification channel should be used to send the notification. If no channel exists yet, you can create a new one from here:
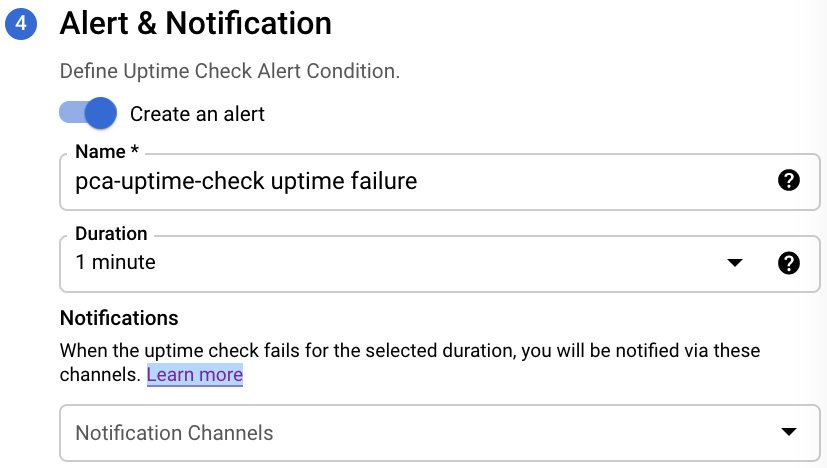
Figure 17.14 – Alert & Notification
Exam Tip
Remember that, for the uptime check to work, the firewall rules need to be created. To check the IPs of the uptime servers, go to the uptime check console and download the list of rules. For details on how to do it, check the documentation: https://cloud.google.com/monitoring/uptime-checks/.
Monitoring agents
To get more out of Cloud Monitoring, a Monitoring agent can be installed on the instance to collect additional metrics. By default, the Monitoring agent collects disk, CPU, network, and process metrics; however, additional metrics can also be collected.
The Monitoring agent is a collectd-based agent that can be installed both on GCP and AWS instances. The agent can be also configured to monitor many applications, including the Apache web server, Tomcat, Kafka, Memcached, and Redis.
The installation of the agent on Linux is very straightforward and requires the following two commands to be executed:
curl -sSO https://dl.google.com/cloudagents/add-monitoring-agent-repo.sh
sudo bash add-monitoring-agent-repo.sh --also-install
To install the agent on a Windows machine, run the following command in PowerShell:
(New-Object Net.WebClient).DownloadFile("https://repo.stackdriver.com/windows/StackdriverMonitoring-GCM-46.exe", "${env:UserProfile}\StackdriverMonitoring-GCM-46.exe") & "${env:UserProfile}\StackdriverMonitoring-GCM-46.exe"
More instructions can be found at https://cloud.google.com/monitoring/agent/install-agent#agent-install-windows.
Exam Tip
To monitor the instance memory, you need to use the Monitoring agent!
Cloud Logging
Cloud Logging is the second most important service. It allows you to store and analyze logs, as well as events coming from GCP and AWS. Based on the logs, alerts can be created. It also provides a robust API, allowing logs to be both managed and injected. This means that any third-party application can leverage Google Cloud's operations suite for logging purposes. The gathered logs are visible in the Legacy Logs Viewer, where they can be filtered and exported for further analysis or archival purposes, or integrated with third-party solutions. There are a number of types of logs, and some of them are not enabled by default. Log-based metrics use log entries and can be leveraged to create dashboard charts and custom alerts. Now, let's take a closer look at how to use logging. We will be looking at the following topics:
- Logs Viewer
- Basic log filtering
- Advanced filtering
- Exporting logs
- Logging agent
- Log-based metrics
- Cloud Audit Logs
- Activity
- Retention
Legacy Logs Viewer
Exam Tip
The Legacy Logs Viewer is a tool that was used in Stackdriver. You can still access it from Google Cloud's operations suite. The new iteration of this tool has a completely new user experience called the Logs Explorer. We will have a look at it in the following section. Keep this section for reference in case you get such a question on the exam.
The Legacy Logs Viewer is a console that allows you to view, filter, and export logs. Keep in mind that logs are associated with a single GCP project:
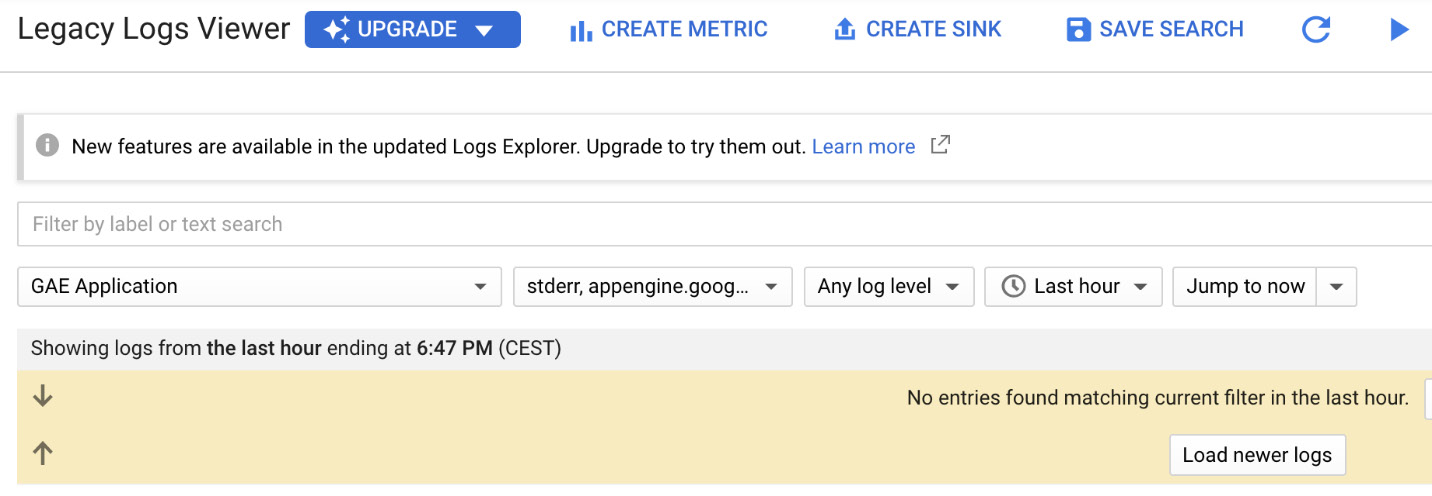
Figure 17.15 – Legacy Logs Viewer
To be able to view logs from other projects, you need to switch the view. An API can be used to get logs from multiple projects. The logs can be filtered, using either basic or advanced filtering, to pinpoint the exact event.
Logs Explorer
The Logs Explorer is a new tool from the Google Cloud operations suite that allows you to inspect your GCP logs. It pops up as the default pane when you open the Cloud Logging service in the GCP console:
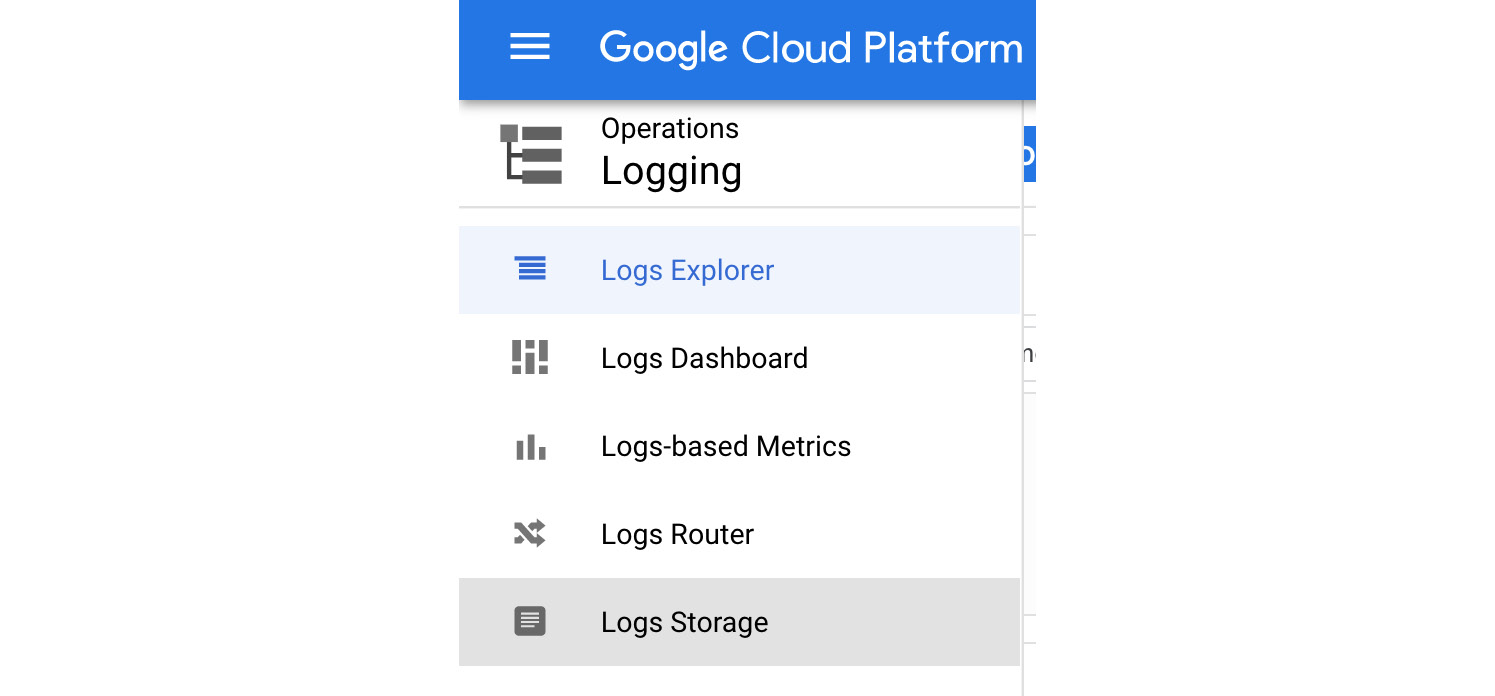
Figure 17.16 – Accessing Cloud Logging
With the Logs Explorer, you can choose to view the logs in two different scopes:
- Scope by project – allows you to search and view logs from a single project
- Scope by storage – allows you to view logs from a bucket that was used as a sink
The second option is very convenient as it allows you to get the same experience from browsing the sink logs as you would get for the logs that still reside in the project:
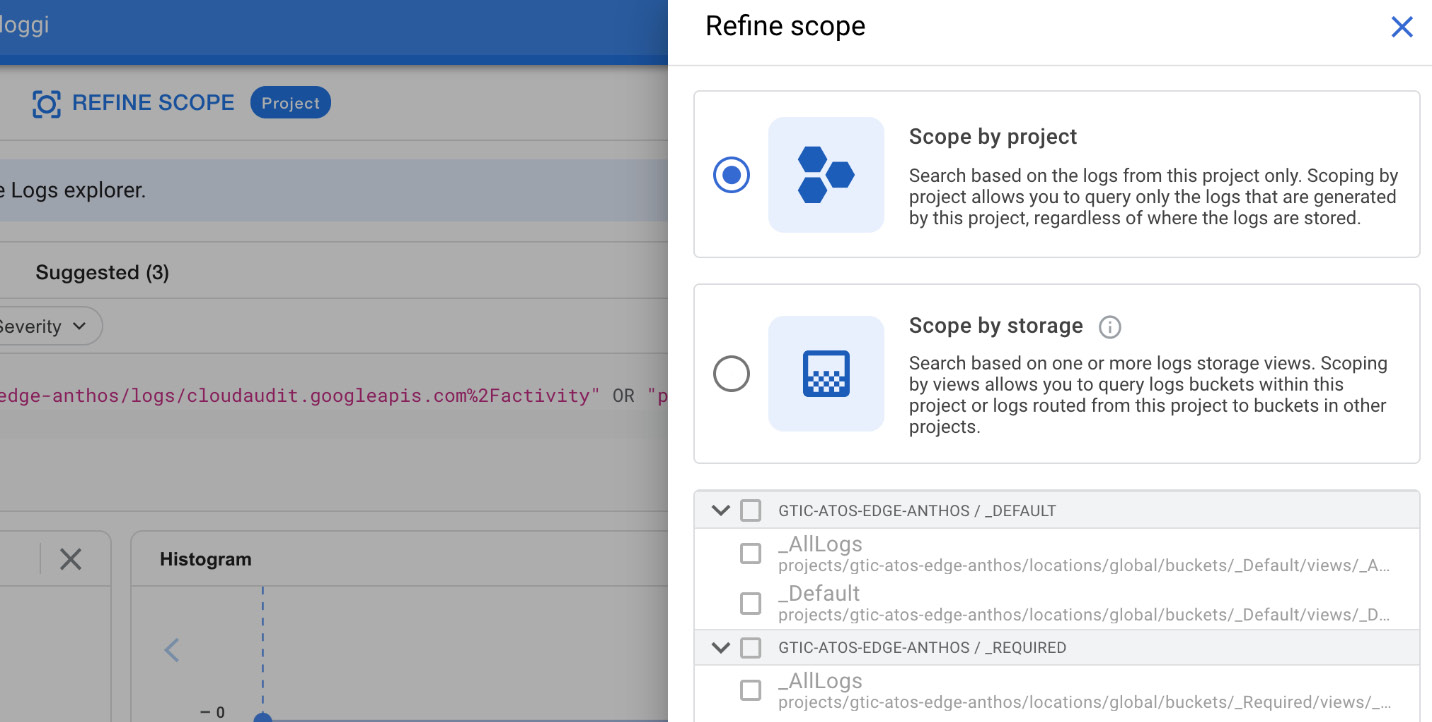
Figure 17.17 – Refine scope
To find the logs you are interested in, you can define a query by simply choosing a filter and then a value from the list of the objects that the filter selected:
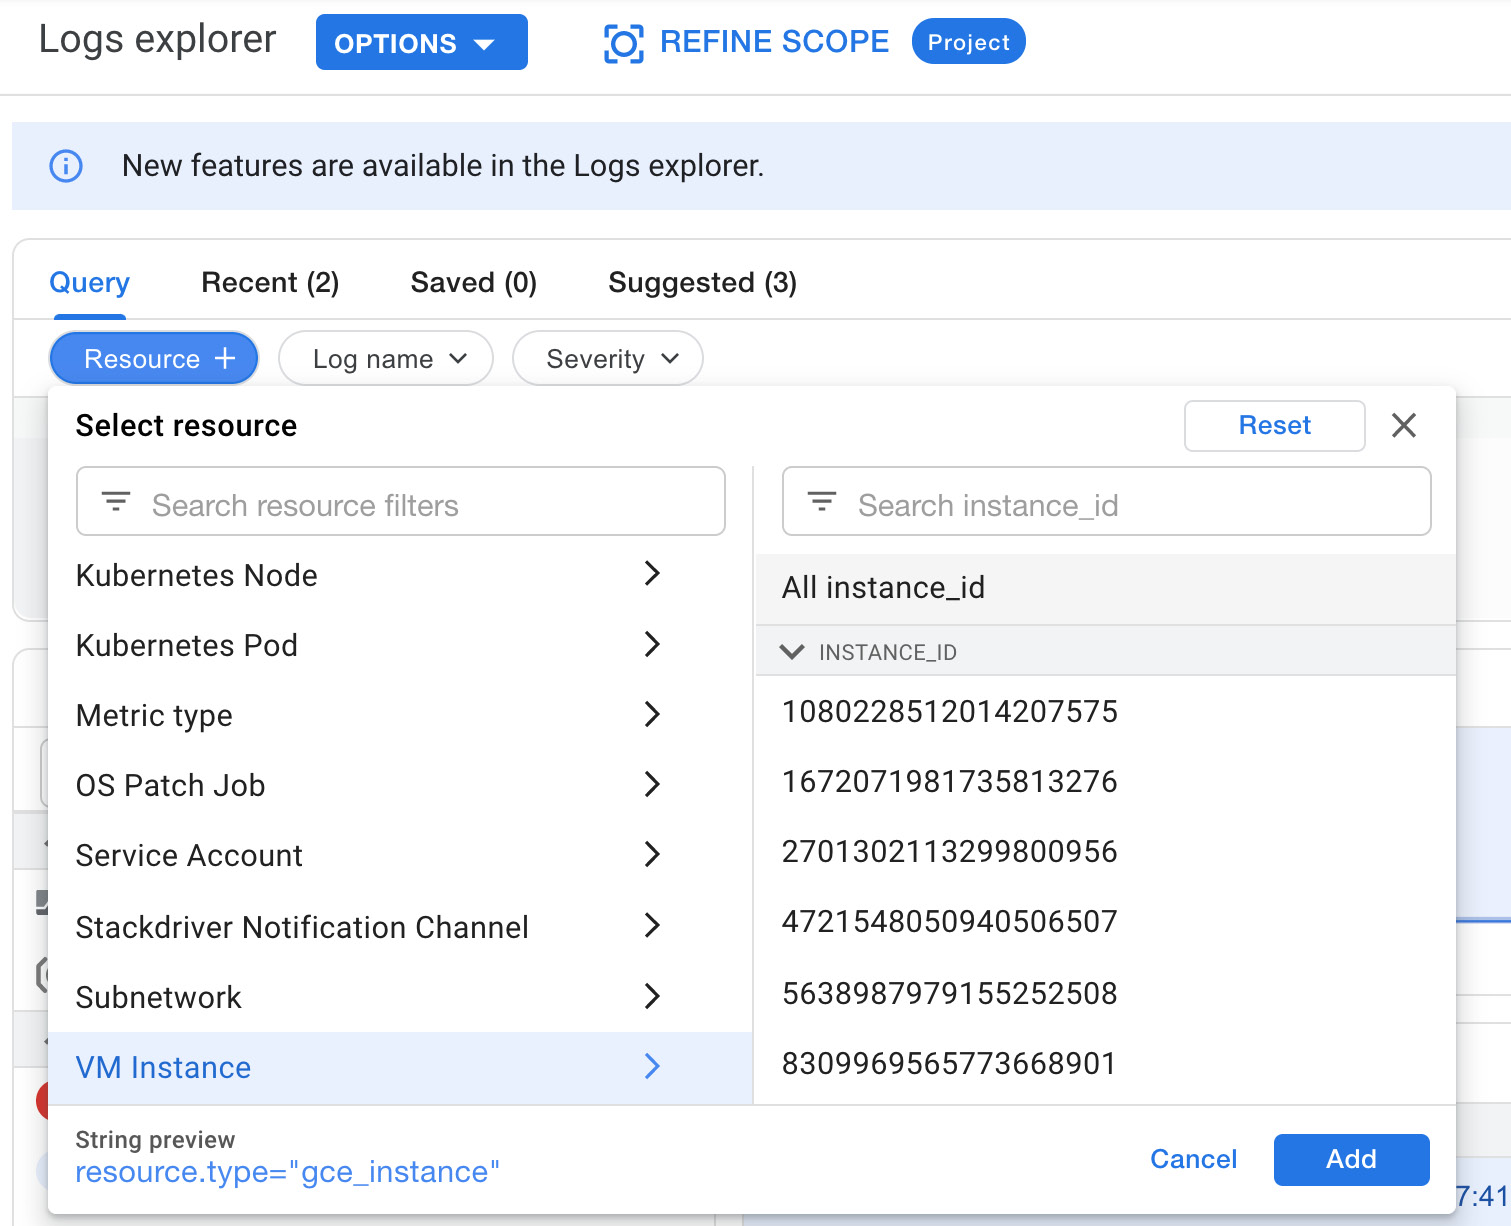
Figure 17.18 – Resource filters
The second filter allows you to choose the type of logs to be displayed, as shown in the following screenshot:
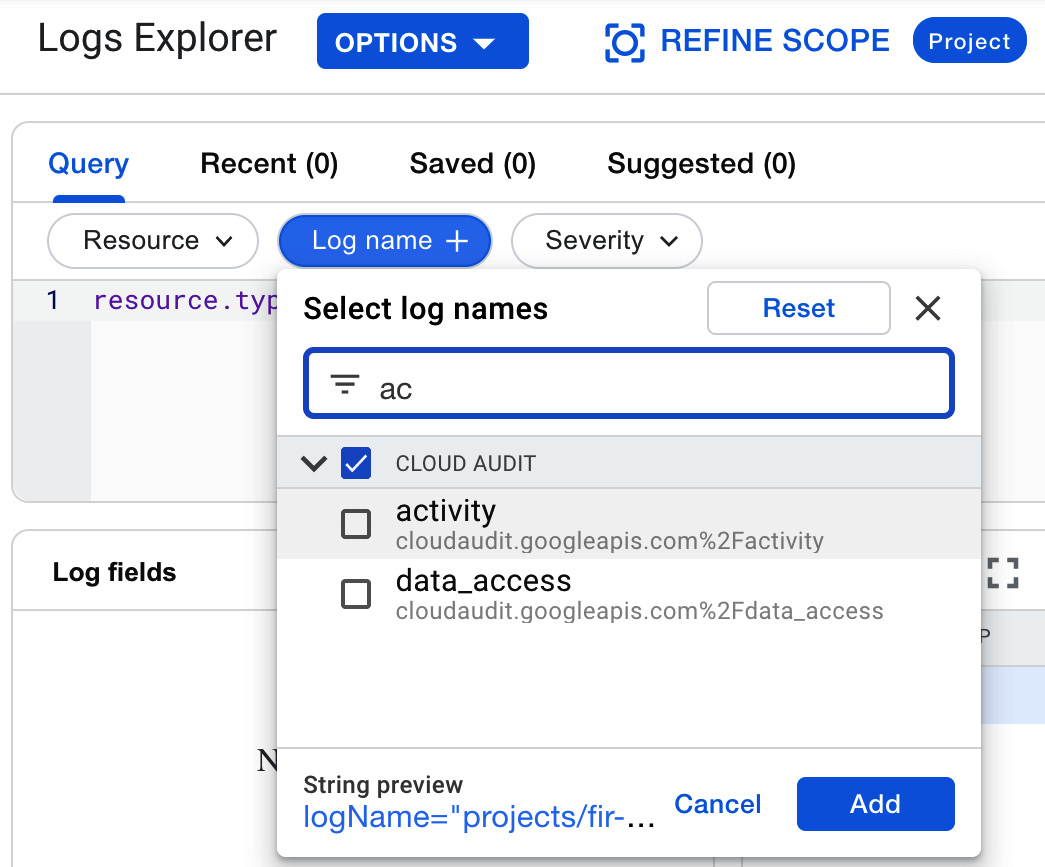
Figure 17.19 – Log name
The third filter allows the level of severity to be chosen:
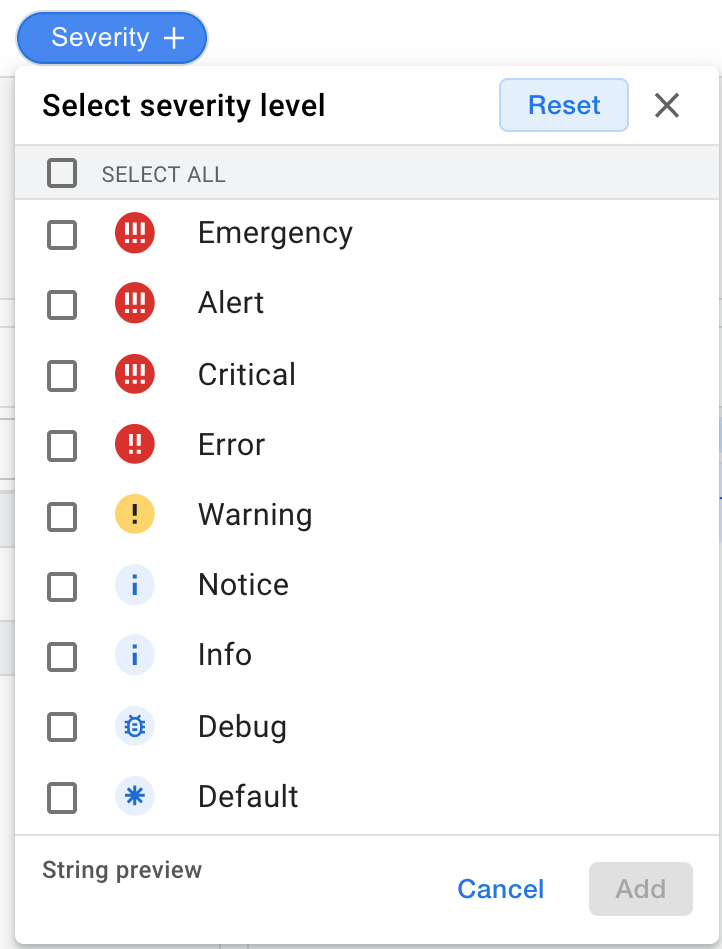
Figure 17.20 – Severity
From the top-right link, you can go to the menu where you can choose the time range:
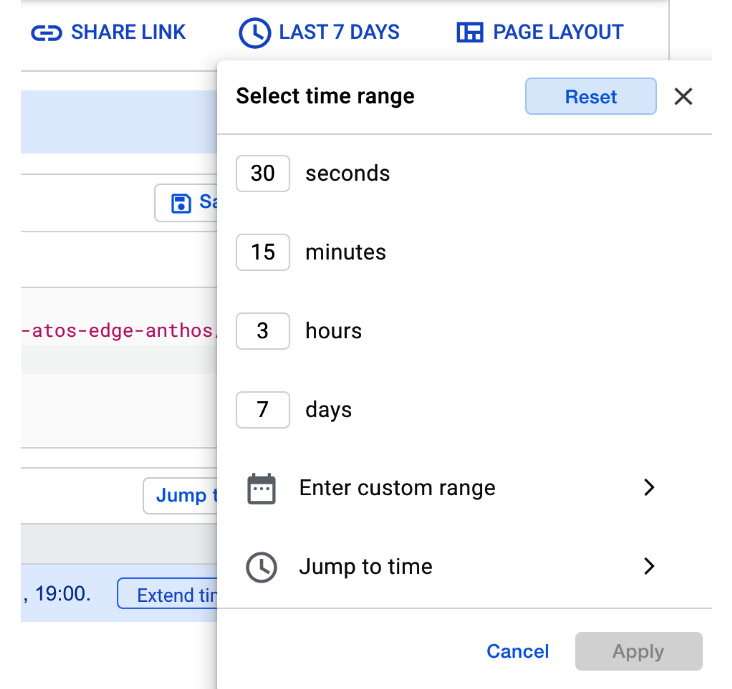
Figure 17.21 – Time range selection
You can also choose from predefined time spans or a custom one. Finally, when we run the query, we get the logs that show when the machine was started:
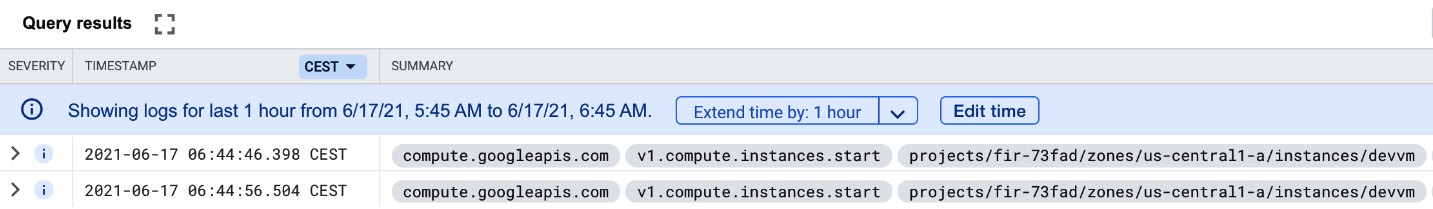
Figure 17.22 – Filtered logs
The severity in this case is at the INFO level.
The preceding example shows logs with a resource type of the GCE instance and a severity of INFO and higher.
Exporting logs
Log entries that are received by logging can be exported (copied) to Cloud Storage buckets, BigQuery data sets, and Cloud Pub/Sub topics. You export logs by configuring log sinks, which then continue to export log entries as they arrive in logging. A sink includes a destination and a filter that selects the log entries to be exported. Remember that only the logs that were created after the sink configuration will be exported:
- To set up an export, go to Logs Router in the Cloud Logging window and click on CREATE SINK:

Figure 17.23 – Logs Router
- In Sink details, fill in the name of the sink and description:

Figure 17.24 – Sink details
- In the Sink destination section, you can choose the service that you want to sink to. These include the following:
- Cloud Logging bucket
- BigQuery data set
- Cloud Storage bucket
- Cloud Pub/Sub topic
- Splunk
- Other project:
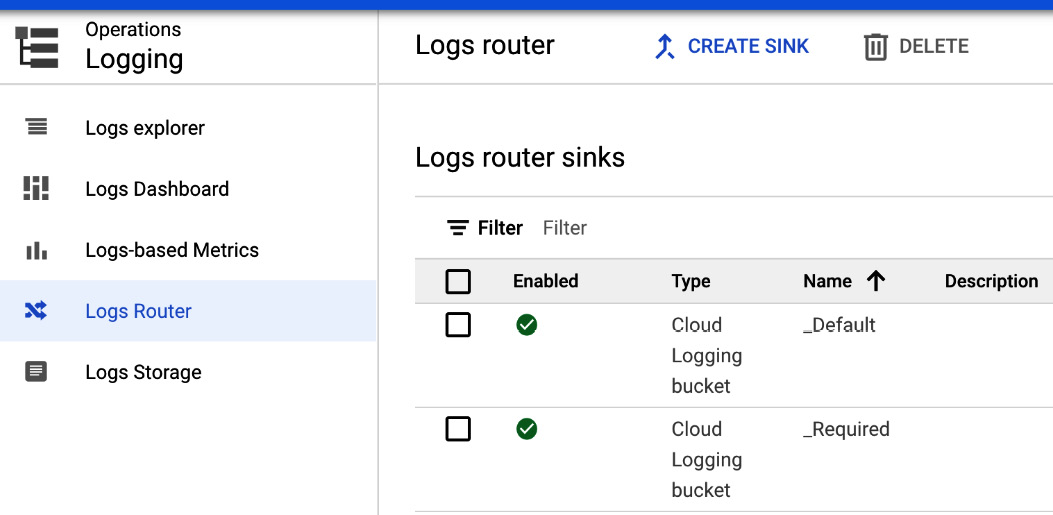
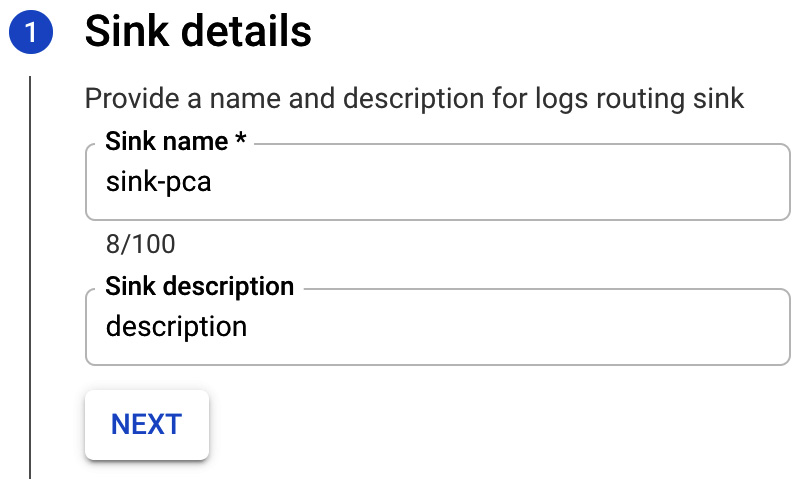
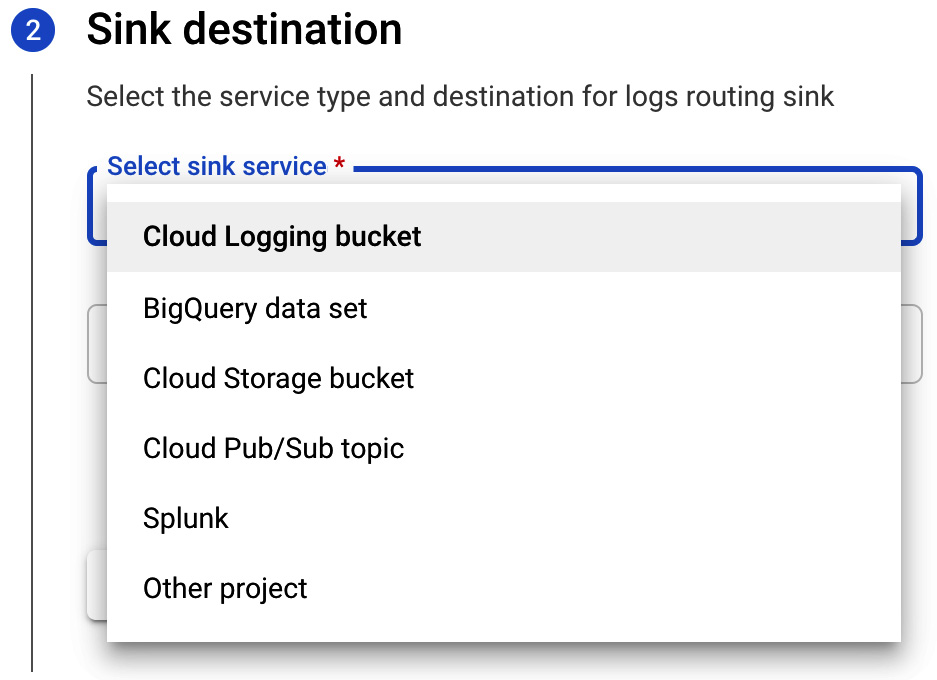
Figure 17.25 – Sink destination
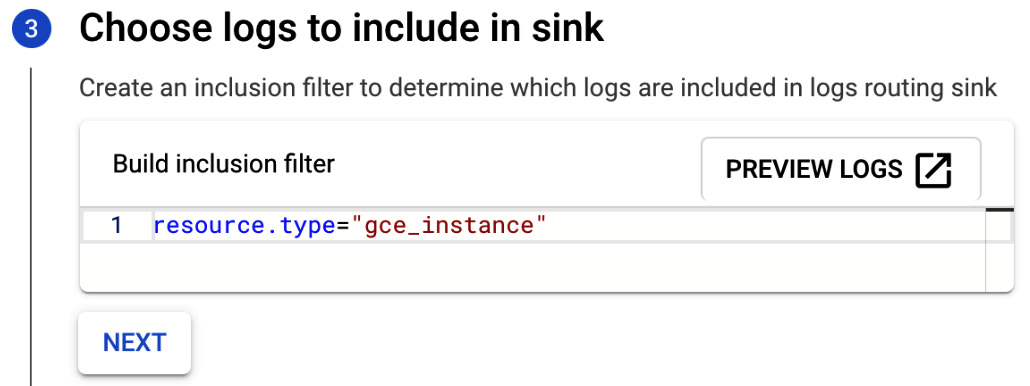
- In choosing the logs to include in the sink section, you can add a filter to define which logs you want to sink. If you leave this blank, all logs will be included. We can use the simple filter we already created. This will give us logs for GCE VM instances:

Figure 17.26 – Choose logs to include in sink
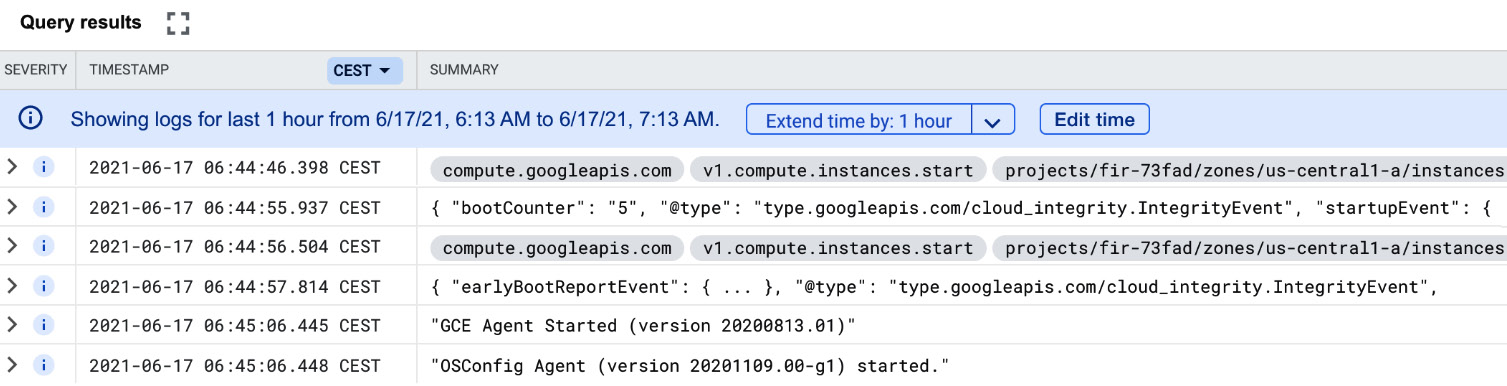
- If you want to check the filters functions correctly, click on PREVIEW LOGS. This will bring you to the Logs Explorer:

Figure 17.27 – Logs preview
- As we can see, all GCE logs are now visible, as the filter did not specify any additional parameters, such as log types.
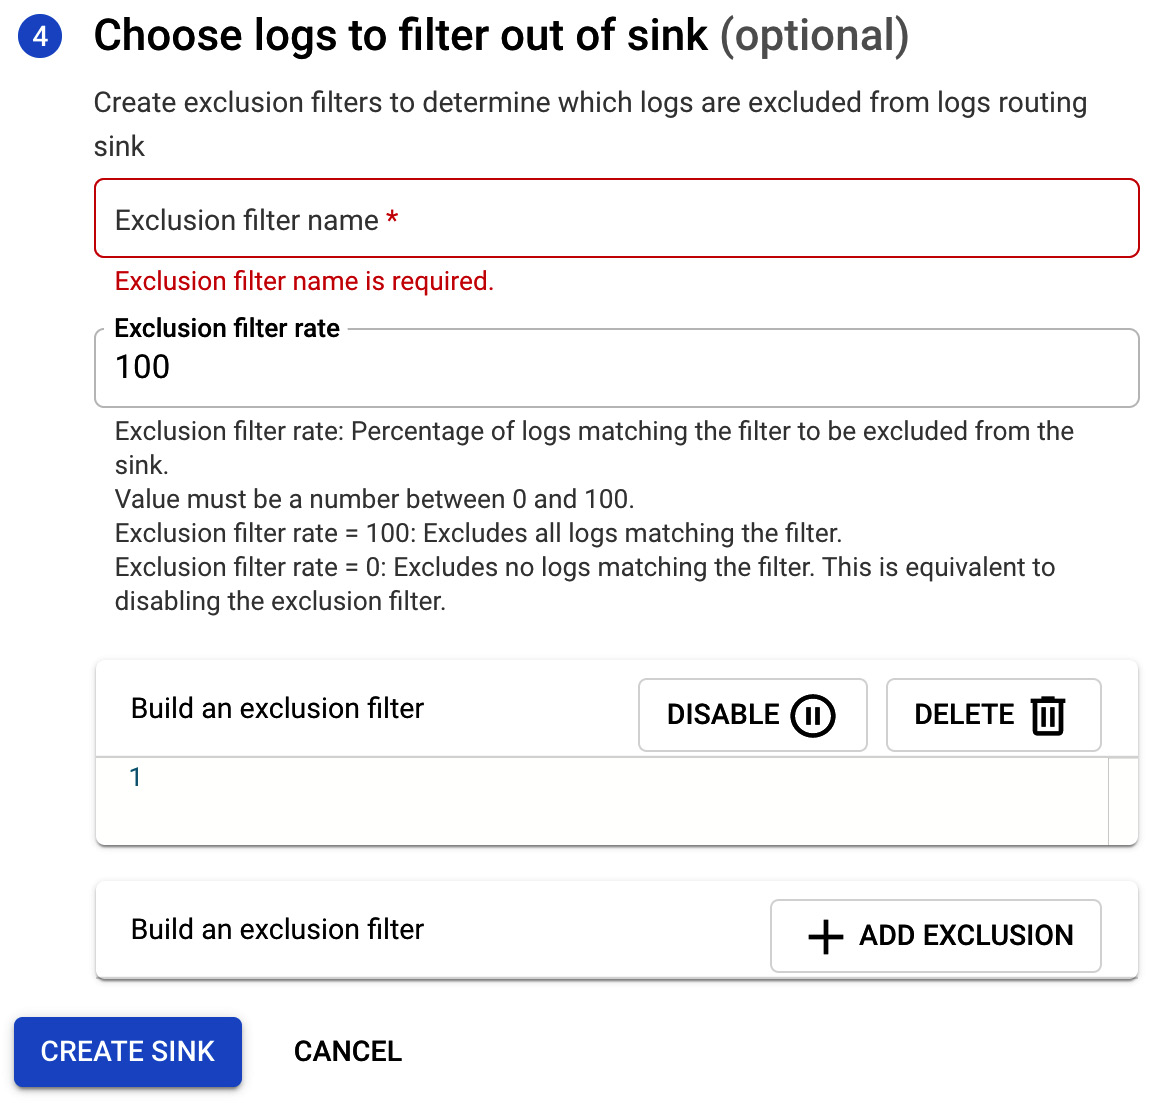
- Finally, you may wish to exclude some logs from the sink. In this section, you choose the exclusion filter name. By setting the exclusion rate, you can decide what percentage of the log should be filtered out. A rate of 100% means that all logs that match the filter will be excluded:

Figure 17.28 – Choose logs to filter out of sink
- You might now wonder why I would want to export the logs. There are a couple of use cases for exporting the logs:
- BigQuery can be used for analytics and queries using SQL.
- A Pub/Sub export allows integration with third-party solutions.
- A Cloud Storage export is the most cost-effective option for archiving the logs.
You might use a dedicated Security Information and Event Management (SIEM) tool such as Splunk for further logs analysis.
Logging agent
The Logging agent is an application that is based on fluentd, and both Linux and Windows machines are supported. It allows the streaming of logs from common third-party applications and system software to Cloud Logging. The agent is included in the images for App Engine and GKE. For Compute Engine and Amazon EC2, it needs to be installed. Installation of the agent on Linux is very simple, and requires the following two commands to be executed:
curl -sSO https://dl.google.com/cloudagents/add-logging-agent-repo.sh
sudo bash add-logging-agent-repo.sh --also-install
By default, the agent streams logs for predefined applications. google-fluentd.conf can be modified to indicate additional logs that should be streamed.
Ops Agent
You might wonder why you need to install two agents to get both the monitoring and logging functionality. Google is trying to solve this by introducing a single agent called the Ops Agent.
At the time of writing, the Ops Agent is a pre-GA offering and is not yet fully supported by Google. The Ops Agent is a combination of the Logging and Monitoring agents. It provides higher throughput and improved resource efficiency. As this still has a limited number of features supported, consult the documentation first before migrating to the Ops Agent: https://cloud.google.com/stackdriver/docs/solutions/agents/ops-agent.
Log-based metrics
Logs can be used to create log-based metrics. Cloud Logging can accumulate logs that are defined by the filter every time a match appears. This data is then exposed to Monitoring and can be used further to create dashboards and alert policies.
As an example, logs containing a particular 404 error message can be counted during a period of 1 minute and exposed as a metric.
The log-based metric can either be system metrics or user-defined:
- System metrics: These are predefined by Cloud Logging.
- User-defined metrics: These metrics are created by a user on a project-by-project basis, based on the filtering criteria.
In the following screenshot, we can see an example of system and user-defined metrics:
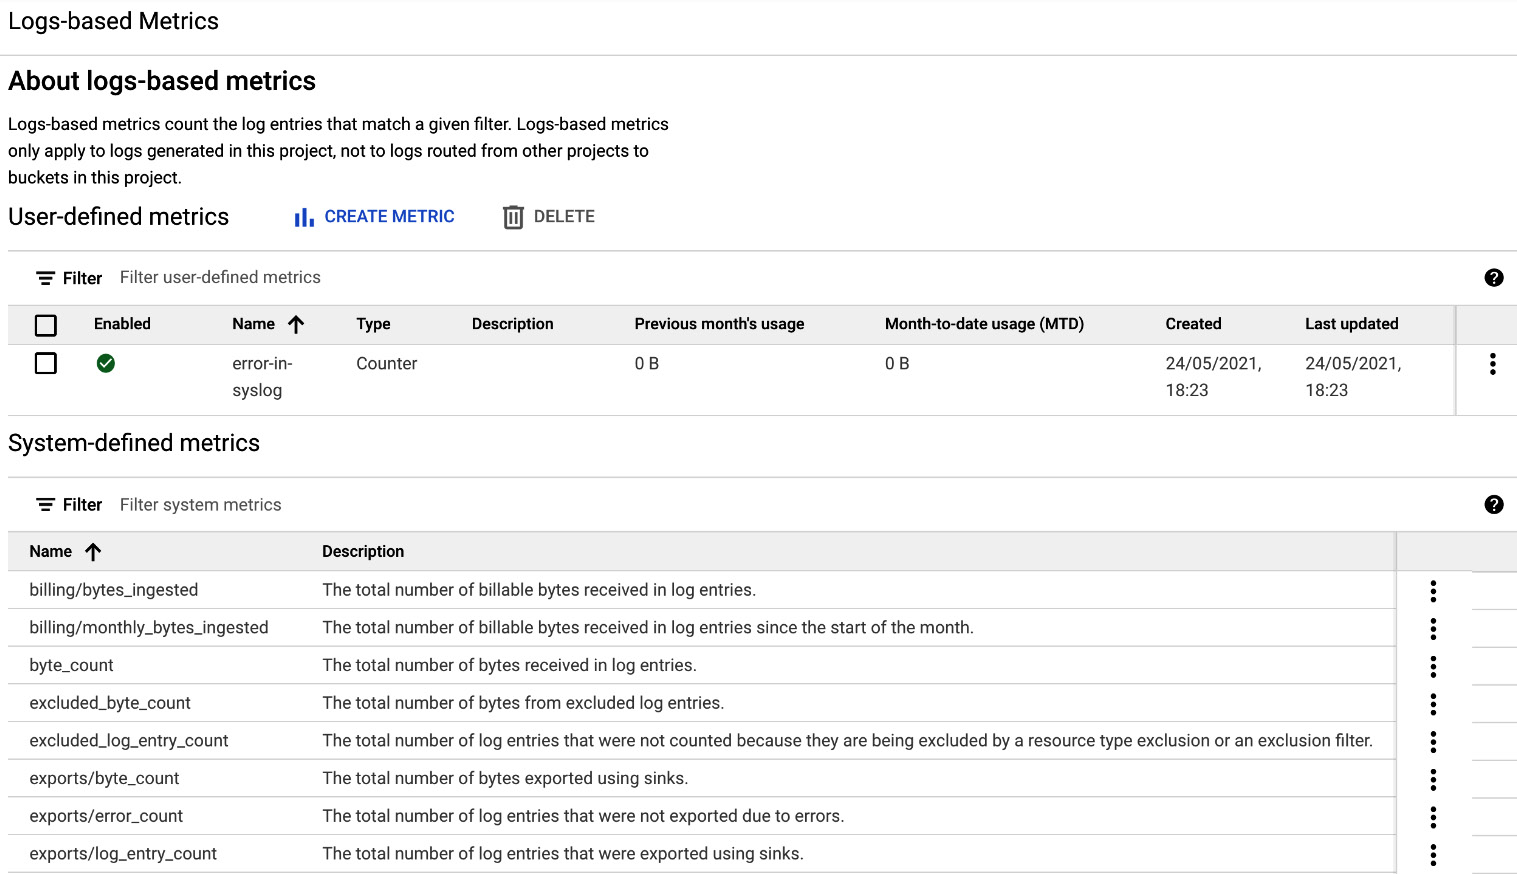
Figure 17.29 – Log-based metrics
Cloud Audit Logs
To understand better who did what?, where?, and when?, Cloud Audit Logs can be used. The logs are stored per project, folder, or organization, and are of the following types:
- Admin Activity
- System Event
- Data Access
- Policy Denied
The first two are enabled by default and cannot be deactivated. The third one is disabled by default, as it can generate a massive amount of information. Audit logs are generated for most of the GCP services. To get the full list of services, refer to the following documentation: https://cloud.google.com/logging/docs/audit/.
The logs can be accessed from the Legacy Logs Viewer, just like any other log, but specific permissions are required to view them. The following are short descriptions of each type of audit log that we mentioned previously:
- Admin Activity audit logs: This contains information about actions on modifying resources' metadata or configuration. These may include, for example, the creation of a VM instance or changes to the permissions. To view the logs, Logging/Logs Viewer or Project/Viewer roles are required. To see only those logs under basic filtering, choose the activity log type.
- System Event audit logs: This contains information on system events for Compute Engine. This may be, for example, the live migration of a VM instance. To view the logs, Logging/Logs Viewer or Project/Viewer roles are required. To see only those logs under basic filtering, choose the system_events log type.
- Data Access audit logs: This contains information on the creation, modification, or reading of user-provided data. To view the logs, Logging/Private Logs Viewer or Project/Owner roles are required. To see only those logs under basic filtering, choose the data_access log type.
- Policy Denied audit logs: This records logs when access is denied to a user or service account due to a security policy violation. These logs are generated by default and your Cloud project is charged for the logs storage. To view these logs, Logging/Logs Viewer or Project/Viewer roles are required.
In the following screenshot, you can see an example of filtering for the Admin Activity audit logs:
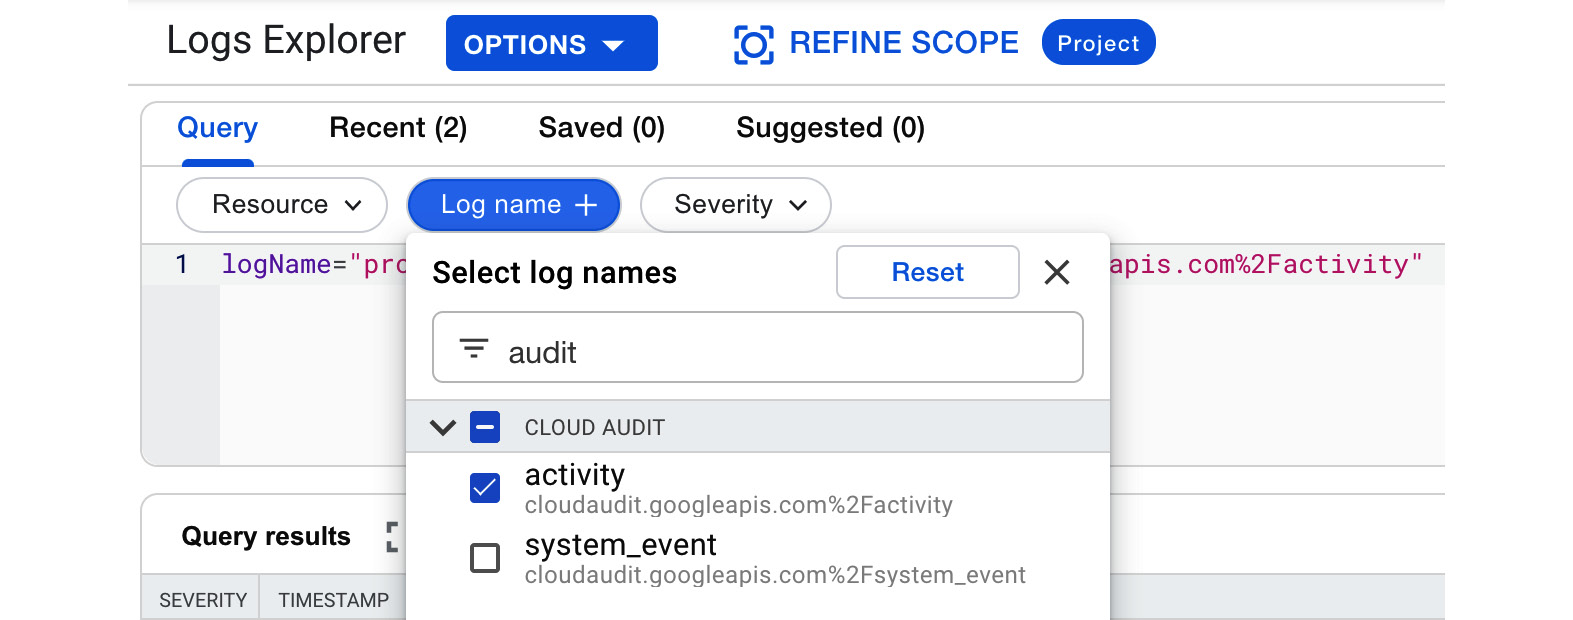
Figure 17.30 – Logs Explorer
While there is no charge for Admin Activity and System Event logs, Data Access logs can incur additional charges when enabled. BigQuery has its own Data Access logs, which are handled separately and cannot be disabled.
Activity
The audit logs can be also viewed from the ACTIVITY tab in the main GCP console screen, which is outside the Google Cloud operations suite console. From the main GCP console screen, click on ACTIVITY in the top-left corner, which will bring you to the log list, as shown in the following screenshot:
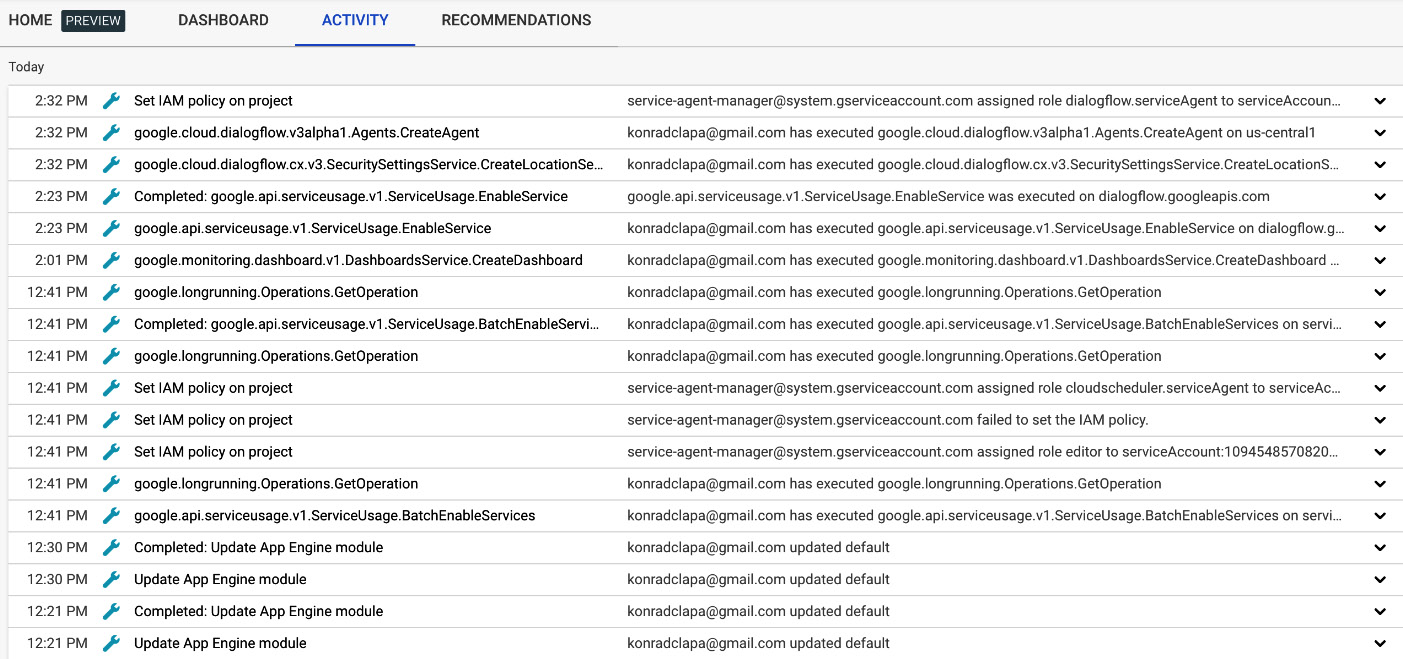
Figure 17.31 – ACTIVITY
The logs are abbreviated and can be filtered by categories, resources, and time periods. By selecting the entries, you can see further details. To narrow down the list of logs, you can use predefined filters, which you will find in the top-right corner. Select the filter and press OK to apply, as shown in the following screenshot:
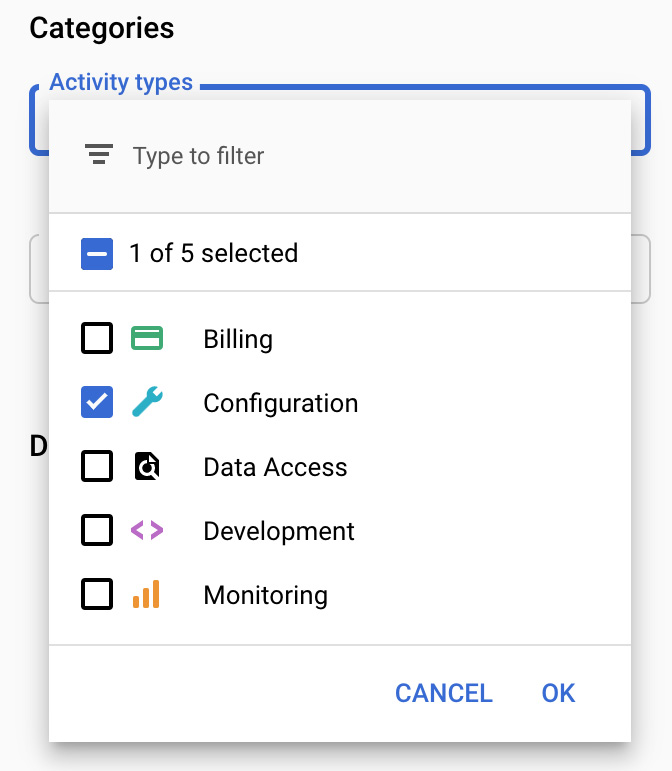
Figure 17.32 – Activity categories
Retention
Retention defines how long the logs are stored in Cloud Logging. After the stipulated period, the logs are removed. Depending on the log types, the retention time differs. Refer to the following list of log types and their retention periods:
- Admin Activity: 400 days
- Data Access: 30 days
- System Event: 400 days
- Policy Denied: 30 days
Note that the logs can be exported and archived for longer periods. We have explained how to export logs in the Exporting logs section of this article.
Google Cloud's operations suite for GKE
Google Cloud's operations suite for GKE is an evolution of GKE Legacy Logging and Monitoring that was deprecated and decommissioned on March 31, 2021.
Cloud Operations for GKE provides observability capabilities for GKE clusters both at the cluster and workload level. It shows you all the most important GKE cluster resources and allows you to drill down to the logs generated by the workload containers.
For all new GKE clusters, the feature is enabled by default. You have, however, a choice to decide what level of monitoring and logging you want to have. Note you can either limit it to the logging and monitoring of the system (a Kubernetes cluster) only or also include the workload (application). All options are visible in the GKE cluster provisioning wizard after clicking on the dropdown in the Select logging and monitoring type form. Those options available are as follows:
- System and workload logging and monitoring
- System logging and monitoring only (beta)
- System and workload logging only (Monitoring disabled)
- System monitoring only (Logging disabled):
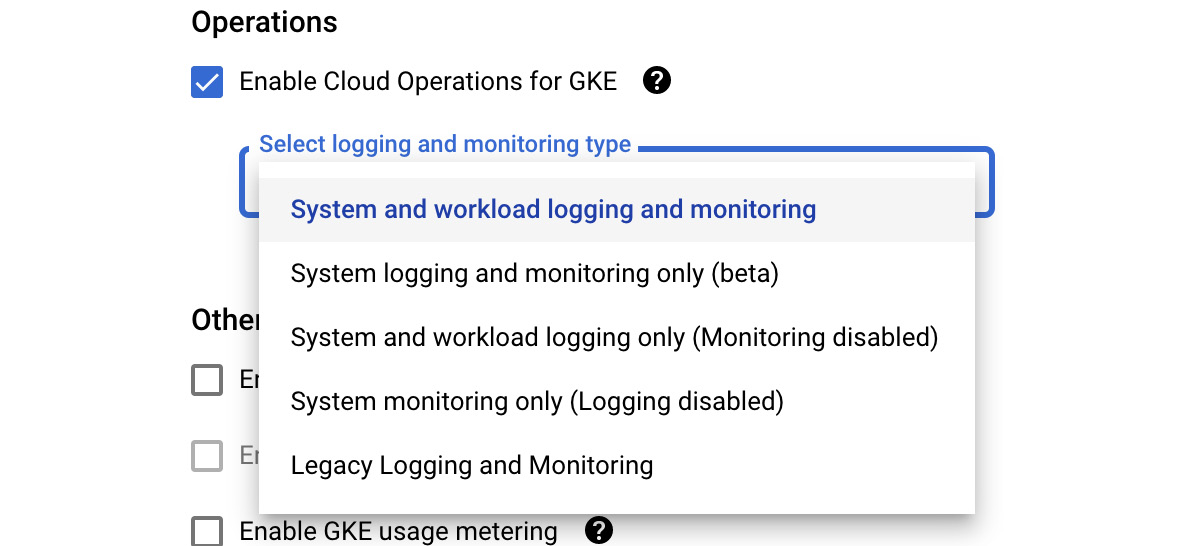
Figure 17.33 – GKE logging and monitoring types
Even though Legacy and Logging and Monitoring is still visible on the screen, it should not be used anymore.
GKE dashboard
Tip
Note that at the time of writing this blog, Google Cloud's operations suite for GKE is available only for GKE clusters running on Google Cloud. This means that it does not include GKE clusters running on-premises or bare-metal servers.
The GKE dashboard is a single pane of glass for the most important metrics for the GKE clusters, including the following:
- Timeline with opened alerts for the GKE clusters
- Metrics such as CPU, memory, and disk utilization for the namespaces, nodes, workloads, services, pods, and containers
- Logs for pods and containers:
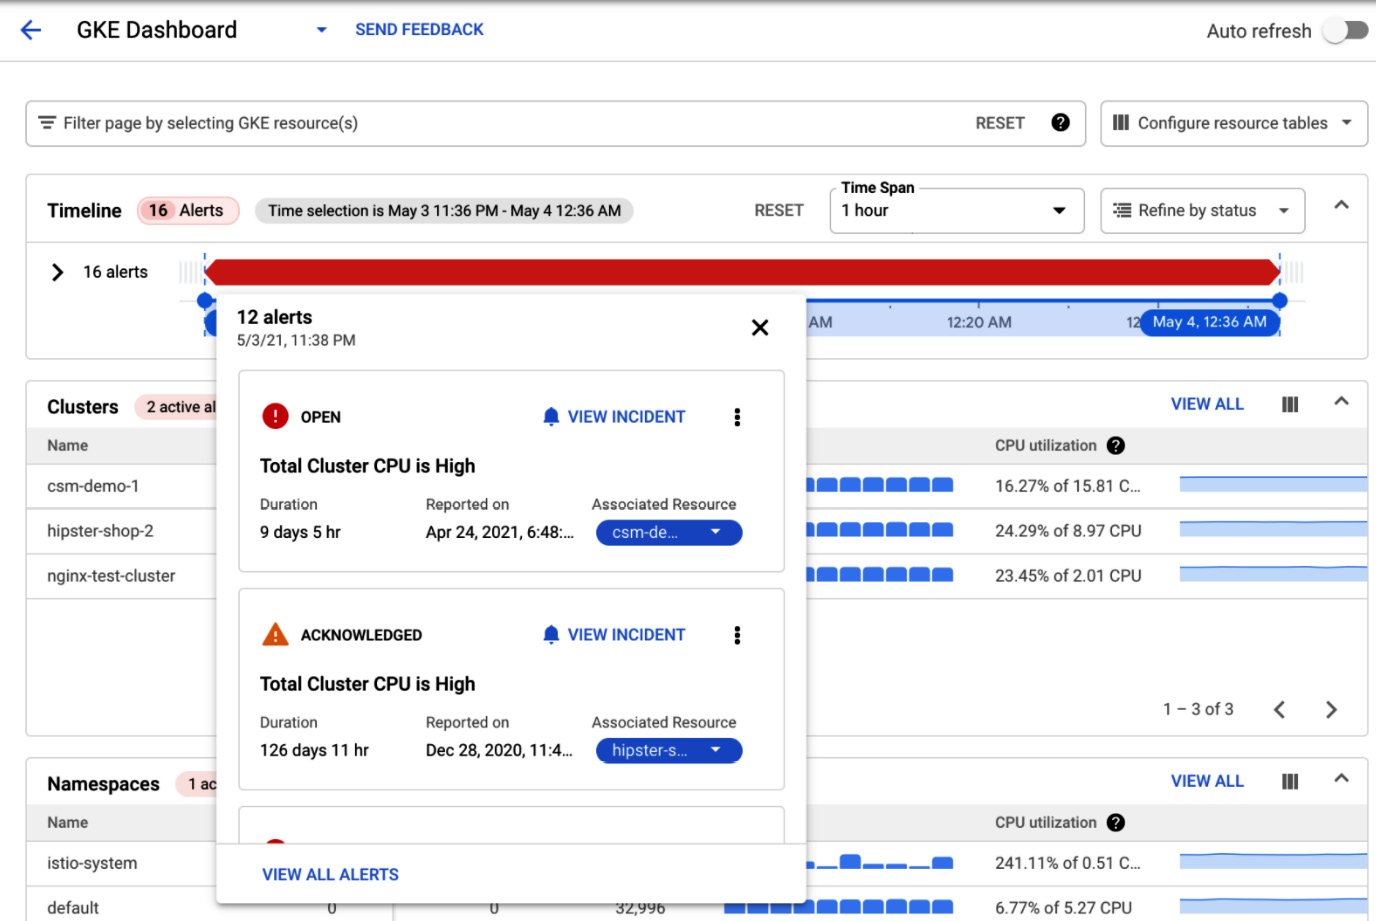
Figure 17.34 – GKE dashboard
The GKE dashboard consolidates all the essential information about your GKE cluster and workloads in a single window. It is very handy to navigate through the Kubernetes resources and pinpoint the issue affecting your application.
APM
APM is a set of tools that developers use to give them some insight into how fast and how reliably they can run an application. It consists of three services:
- Trace
- Debugger
- Profiler
These tools are integrated into the code of the application. The application does not need to be hosted on GCP but can run in any cloud or even on-premises, as long as connectivity is available. APM originates from Google's Site Reliability Engineering (SRE) team toolset. So, it is high time that we got into the shoes of SRE!
Trace
Cloud Trace allows you to track latencies in your microservices application. It shows you the overall time of the application responses but can also show detailed delays for each of the microservices. This allows you to pinpoint the root cause of the latency.
The traces are displayed in the GCP console, and analysis reports can be generated. By default, it is installed on Google App Engine (GAE) standard, but it can be used with GCE, GKE, GAE flexible, and non-GCP machines. The tracing mechanism needs to be incorporated using the Cloud Trace SDK or API.
Debugger
This allows you to debug errors in the code of your application, without stopping the application. Developers can request a real-time snapshot of a running application, capturing the call stack and local variables. Debug log points can be injected into the code to display additional information. These can even be done in production, without affecting the end users.
By default, it is installed on GAE standard, but it can be used with GCE, GKE, GAE flexible, and non-GCP machines. It does not require a Logging agent.
Profiler
Cloud Profiler shows you how many resources your code consumes. With the changes in the code in your application, there may be an unexpected rise in the demand for resources. Profiler allows you to pinpoint those issues, even in production. It uses a piece of code called the profiler agent that is attached to the main code of your application, and it periodically sends information on resource usage. It currently supports Java, Go, and Node.js, and can be used with GCE, GKE, GAE flexible, and non-GCP machines. The following screenshot presents an example of Cloud Profiler with the CPU profile:
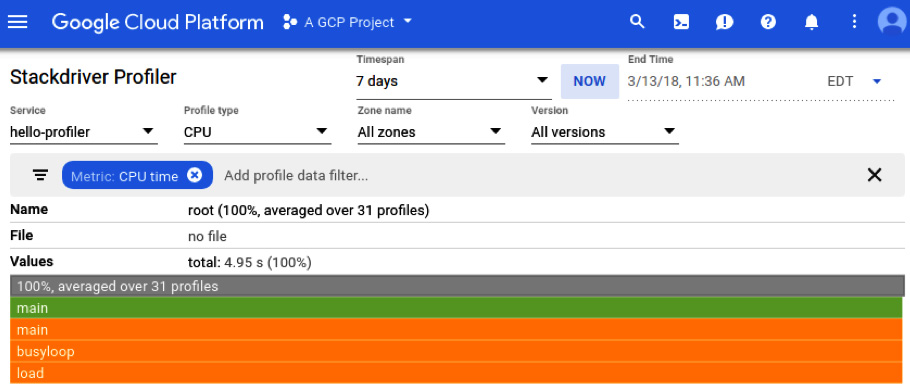
Figure 17.35 – Profiler (Source: https://cloud.google.com/profiler/docs/quickstart. License: https://creativecommons.org/licenses/by/4.0/legalcode)
Error Reporting
Error Reporting allows you to collect and aggregate errors that are produced by your applications in a single place. The collected errors can be grouped and displayed in a centralized interface. This way, you can see how many crashes have occurred over a specific time period.
The service works in a very similar way to Cloud Logging, but it allows you to filter only the most important errors and pinpoint the root cause of the crash. Error Reporting works with Cloud Functions, App Engine, GCE, GKE, and AWS EC2. It is, by default, enabled for the App Engine standard environment. Multiple languages, such as Go, Java, .NET, Node.js, PHP, Python, and Ruby are supported. There are two ways to leverage error reporting:
- You can use the Cloud Logging API and send properly formatted error messages.
- You can call the dedicated Error Reporting API.
Information in Error Reporting is retained for 30 days.
Summary
In this article, we learned about Google Cloud's operations suite and how to monitor GCP services, resources, and applications. There are three main functionalities that we looked into: Monitoring, Logging, and APM.
To enhance monitoring and logging capabilities, install agents on the instances. Monitoring allows predefined metrics to be monitored. Logging allows you to create log-based metrics. Alert policies can be created on conditions, and they can send notifications to endpoints of your choosing. Tracing facilitates an understanding of the latency of your application components, including microservices and load balancers. Debugging allows you to look at a snapshot of the code that is causing an error, without stopping the application. Profiler shows how many resources are used by different components of the application. Finally, Error Reporting aggregates the error logs of the application and displays them on timescale charts.
In the exam, some questions may refer you to several case studies with which you should be familiar before you take the exam. These case studies explain fictitious business and solution concepts. In the next article, we will cover how to find these case studies, and we will look at an example case study and analyze it, in order to design an appropriate solution.
Further reading
If you want to learn more about Google Cloud's operations suite, use the official Google documentation:
- Google Cloud's operations suite docs: https://cloud.google.com/stackdriver/docs/
- Monitoring agent: https://cloud.google.com/monitoring/agent/
- Logging agent: https://cloud.google.com/logging/docs/agent/
- Debugger: https://cloud.google.com/debugger/docs/setup/python
- Profiler: https://cloud.google.com/profiler/docs/about-profiler
- Error Reporting: https://cloud.google.com/error-reporting/docs/setup/compute-engine