 Online analytical processing (OLAP) uses a multidimensional approach to organize and analyze business data. By storing data in highly optimized structures, businesses can very quickly explore the data and uncover important insights that would otherwise remain hidden. As a result, OLAP enables companies to achieve key organizational goals, including wide-ranging business intelligence.
We begin this article by defining OLAP within the larger context of business intelligence. Then we review the benefits you can expect to see by implementing OLAP technology in an organization. Next, we have an OLAP primer - a short introduction to what makes up an OLAP system and what kinds of OLAP implementations are possible. This foundation enables us to introduce Oracle's two OLAP solutions - Oracle OLAP and Oracle Essbase - i and review some case studies. The ch ends with a section on architecting an OLAP solution, which compares and contrasts Oracle's two OLAP products and provides guidance on selecting the correct product for your organization.
OLAP as a Component of Business Intelligence
To explain how OLAP technology contributes to business intelligence (BI), we first need to define BI itself. BI means different things to different people. For some people, BI is only the data warehouse. Others see BI as the dashboards on their desktops. In this book, we define BI as all of the processes and technologies used to help businesses make better decisions.
BI includes the following:
- Enterprise performance management
- Data warehousing
- Business reporting, including dashboards and scorecards
- Predictive analytics and data mining
- OLAP
Together, these technologies support an organization's ability to create, maintain, analyze, and report accurate information about the business, and use that information for forward-facing activities such as budgeting and forecasting. The next sections define each of the technologies so that you can understand exactly what OLAP contributes to BI.
MOLAP_advantages_andchallenges
Enterprise performance management (EPM) is a set of processes and related software that supports management excellence. EPM organizations are smart, agile, and aligned.
Smart organizations recognize that they must rationalize their analytical tools and data management systems to eliminate the noise and provide actionable insights to all the stakeholders of the enterprise.
Agile organizations are able to detect deviations between plans and execution quickly, find the root causes, and take fast corrective actions. They use best-of-breed technologies that offer advanced integration with operational systems, yet can be used easily with a company's existing architecture and information technology (IT) investments.
Aligned organizations address the needs of all stakeholders and share information through integrated systems and processes so that all stakeholders are working from the same set of facts - that is, the same data.
Data Warehousing
The objective of a data warehousing system is to provide business users with a time- based, integrated view of cross-functional data. To create a data warehouse, we start with data that may exist in different formats across several systems. We transform the data, cleanse it, and create an integrated view of the data.
Data warehousing provides historical data, as opposed to the current snapshot of data that can be found in an online transaction processing (OLTP) system. A data warehouse does not answer the question "What orders are shipping now?" but rather reporting questions such as "How many orders did we ship last month?" and analytical questions such as "When have we shipped orders the fastest?"
A data warehouse offers a central, reliable repository of historical business data that all stakeholders can use. End users can write queries to pull data from this single source of data, so that regardless of who asks the question, they will get consistent answers.
Business Reporting
Business reporting is about conveying information that is important to the organization and using that data to manage the business. Business reports have been around since the first data management systems were implemented.
The original medium of reports was paper documents. Today, many organizations implement business reports online through dashboards and scorecards. Business reports often require current data, and they can be widely distributed within an organization.
Predictive Analytics and Data Mining
Predictive analytics is concerned with examining historical data using statistical tools and techniques, such as regression or data mining, to forecast or predict future events and to determine the factors that best predict an event.
For example, using historical data, a company could forecast a customer's price point for a certain product. By determining each customer's profile, the company could manage its revenue stream better by charging different customers different prices. This would allow the company to increase revenue while maintaining customer satisfaction. After these models are developed, analysts can look for exceptions to the model for activities such as anomaly and fraud detection.
OLAP
OLAP is a technology that supports activities ranging from self-service reporting and analysis to purpose-built management applications such as planning and budgeting systems. What differentiates OLAP from regular business reporting is the analytics. In an OLAP application, metrics are often compared with a baseline, such as last year's numbers or the performance of the whole United States. Over the course of this book, we describe OLAP technology in general and Oracle's products for OLAP in particular.
The next two sections provide a foundation upon which you can begin to build up your understanding of OLAP technology and OLAP products. We describe the benefits of OLAP, and then provide some basic information about OLAP systems and implementations.
Why OLAP?
An effective OLAP solution solves problems for both business users and IT departments. For business users, it enables fast and intuitive access to centralized data and related calculations for the purposes of analysis and reporting. For IT, an OLAP solution enhances a data warehouse or other relational database with aggregate data and business calculations. In addition, by enabling business users to do their own analyses and reporting, OLAP systems reduce demands on IT resources.
OLAP offers five key benefits:
- Business-focused multidimensional data
- Business-focused calculations
- Trustworthy data and calculations
- Speed-of-thought analysis
- Flexible, self-service reporting
The next sections describe each of these benefits of OLAP.
Business-Focused Multidimensional Data
As mentioned in the first sentence of this blog, OLAP uses a multidimensional approach to organize and analyze data. In a multidimensional approach, data is organized into dimensions, where a dimension reflects how business users typically think of the business. For example, business users may view their data by product, by market, and over time. Each of these is a dimension in an OLAP application. Note that business users instinctively refer to dimensions after prepositions such as by (by product/by market), over (over time), or across (across business units).
A dimension can be defined as a characteristic or an attribute of a data set. Each dimension contains members that share the common characteristic. The members are often organized hierarchically within the dimension. For example, Figure 1 -1 contains a few dimensions and their members. The Time dimension, which represents a year, is divided into quarters, and each quarter into respective months. The Products dimension contains product groupings and then the individual products within each grouping. The Markets dimension demonstrates a division into geographic regions divided further into states.
The hierarchical aspect of the dimension represents the first option for aggregation. For example, Quarter 1 summarizes the data for its child members January, February, and March. Time summarizes the data for all four quarters in the year. The aggregations are inherent in the hierarchy. The metadata in an OLAP system contains the aggregation rules, freeing the application from needing to define these aggregation rules and ensuring that these rules are applied consistently for each report or analysis.
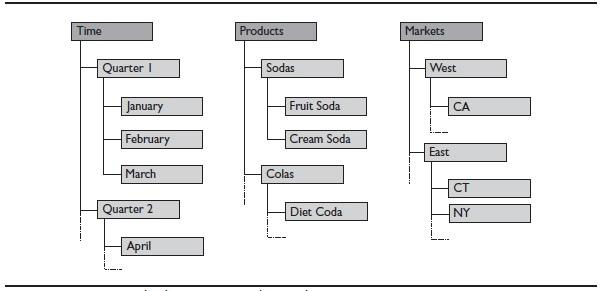
Figure 1-1. Sample dimensions with members
We describe the multidimensional approach more fully in the next late. For now, it is enough to understand that OLAP organizes data in a multidimensional model that makes it easy for business users to understand the data and to use it in a business context, such as a budget.
Business-Focused Calculations
One reason OLAP systems are so fast is that they preaggregate values that would need to be computed on the fly in a traditional relational database system. The calculation engine handles aggregating data as well as business calculations. In an OLAP system, the analytic capabilities are independent from how the data is presented. The analytic calculations are centrally stored in the metadata for the system, not in each report.
Here are some examples of calculations available within an OLAP system:
- Aggregations, which simply roll up values based upon levels organized in hierarchies. For example, the application may roll up sales by week, month, quarter, and year.
- Ti me-series calculations with time intelligence, such as percent difference from last year, moving averages, and period-to-date values.
- Matrix or simple intradimensional calculations, such as share of parent or total, variances, or indexes. For those readers used to spreadsheets, this type of calculation replaces embedded spreadsheet formulas.
- Cross-dimensional or complex interdimensional calculations, such as index of expenses for current country to revenue for total United States. Someone using only spreadsheets would need to link spreadsheets and create formulas with values from different sheets to accomplish this type of calculation.
- Procedural calculations, in which specific calculation rules are defined and executed in a specific order. For example, allocating a shared expense, like advertising across products, as a percent of revenue contribution per product is a procedural calculation, requiring procedural logic to model and execute sophisticated business rules that accurately reflect the business.
- OLAP-aware calculations, with specialized functions such as ranking and hierarchical relationships. These calculations can include time intelligence and financial intelligence. For example, an OLAP-aware calculation would calculate inventory balances in which quarter 1 ending inventory is understood to be the ending inventory of March, not the sum of January, February, and March inventories.
- User-defined expressions, allowing a user to combine previously defined calculations using any operators and multidimensional functions.
Trustworthy Data and Calculations
When electronic spreadsheets, such as VisiCalc and Lotus 1-2-3, were released in the late 1970s and early 1980s, business analysts, who were already familiar with paper-based spreadsheets, embraced these new tools. Analysts would create spreadsheets starting from raw data and spend hours formatting and massaging the data into a form they could use. They would develop dozens to hundreds of these sheets. In turn, their organizations began to rely on an inordinate number of these manually produced spreadsheets for extremely important information.
Unfortunately, as soon as data starts living in spreadsheets, users start changing the data, entering new data, and creating calculations to augment what is already there. Soon, there are multiple definitions of something as basic as sales or profit. The resulting confusion gave rise to a phenomenon that came to be known colloquially as "spreadsheet hell." To get a sense of the depth of the problem caused by spreadsheet hell, consider the following scenario: There are ten people in a room, each with his own spreadsheet containing his own metrics, formulas, and numbers. None of the spreadsheets contains exactly the same data. It becomes exceedingly difficult, if not impossible, for management to make sound business decisions when no one can agree on the underlying facts.
The problem is not limited to just spreadsheets. Many organizations have multiple reporting systems, each with its own database. When data proliferates, it is difficult to ensure that the data is trustworthy.
OLAP systems centralize data and calculations, ensuring a single source of data for all end users. Some OLAP systems centralize all data in a multidimensional database. Others centralize some data in a multidimensional database and link to data stored relationally. Still other OLAP systems are embedded in a data warehouse, storing data multidimensionally within the database itself. Regardless of the implementation details, what is important is that OLAP systems ensure end users have access to consistently defined data and calculations to support BI.
Speed-of-Thought Analysis
Speed-of-thought analysis (also referred to as ad hoc analysis) means that analysts can pose queries and get immediate responses from the OLAP system. Not needing to wait for data means fewer interruptions in the analyst's train of thought. The analyst can immediately pose another query based on the results of the first query, then another query, and so on, leading the analyst on a journey of discovery. Fast response times, together with intuitive, multidimensional organization of data, enable an analyst to think of and explore relationships that otherwise might be missed.
For example, consider a company that experiences a sudden increase in the number of customer complaints concerning late product shipments. In investigating the issue, the analyst drills down into the financial cube and discovers that profits are at a record high. She then drills down on the average age of the company's payable invoices to discover that the average age is growing at a very high rate. Finally, the analyst drills down into inventories and discovers that raw materials are at low levels. From this analysis, she can draw the conclusion that the finance officer started paying invoices late, which improved short-term cash flow and profits, but now the company's vendors are upset and shipping later. Late shipments of raw materials translates into late products and an increasing number of related consumer complaints. Speed-of-thought analysis is a key component that enables this kind of drill-down investigative work across multiple functional areas.
OLAP systems respond much faster to end-user queries than do relational databases that do not capitalize on OLAP technology. Quick response times are possible because OLAP systems preaggregate data. Preaggregation means that there is no need for many time-consuming calculations when an end-user query is processed. In addition, OLAP systems are optimized for business calculations, so calculations take less time to execute.
OLAP systems make the analysis process easy for analysts by supporting tools they already use. For example, many OLAP systems support commercial spreadsheet tools such as Microsoft Excel or offer their own spreadsheet interface.
Flexible, Self-Service Reporting
The best report designers and builders usually come from within the business community itself because they know what is needed. Enabling these people to create their own reports is a hallmark of an OLAP system.
OLAP systems enable business users to query data and create reports using tools that are natural for them to use. Providing tools that are familiar to end users means that their learning curve is reduced, so they are more likely to use the system. In addition to commercial and custom spreadsheet applications, OLAP systems support other front-end reporting tools that are designed with business users in mind. For example, they include user-friendly tools that enable report designers to create and publish web-based dashboards and interactive reports using live OLAP data. The consumers of interactive reports are often able to customize their view of the data.
When business users can build their own reports, it reduces the reliance on IT resources for generating reports. Without an OLAP system, IT departments are often called upon to create a multitude of materialized views and specialized reports for business users on demand.
As with any application geared to business users, the front-end tools must be intuitive and flexible enough to be employed by casual users. That said, as with any new tool, people need to be trained on how to use these reporting facilities effectively. If end users deem the system too hard to use, they will not adopt it.
OLAP Primer
In this introduction to OLAP, we provide an overview of OLAP system components and implementations.
OLAP System Components
In describing the benefits of OLAP, we used the term OLAP system. An OLAP system is made up of the following four primary components:
- Server The OLAP server hosts the multidimensional data storage and runs the calculation engine. An OLAP server can be a stand-alone server or embedded within a relational database. For example, Essbase can run on a stand-alone server. Oracle OLAP is contained within the Oracle Database. The latter part of this blog describes similarities and differences between Essbase and Oracle OLAP.
- Multidimensional storage OLAP data is stored multidimensionally in constructs often referred to as A cube is a useful concept for explaining multidimensionality. Dimensions (such as products, markets, and time) form the edges of the cube. Members from each dimension create intersections within the cube, each of which can potentially hold a data value. Depending on how an OLAP system is implemented, cubes can be stand-alone multidimensional databases or data objects within a relational database.
- Calculation engine The OLAP engine handles aggregation of data and optimizes business calculations. Calculations are centrally stored in the metadata for the system, rather than in specific reports or applications. We talk more about calculations throughout this book.
- Front-end analysis and reporting tools Front-end analysis and reporting tools communicate with the OLAP server and present multidimensional data to the end user. As mentioned earlier in this article, OLAP systems support user-friendly tools for analysis and reporting, including commercial and custom spreadsheet applications and functions for creating web-based dashboards and interactive reports.
OLAP Types
If you have read about OLAP before picking up this book, you may have come across a description of the various types of OLAP implementations. Three main types of OLAP are available: multidimensional OLAP, relational OLAP, and hybrid OLAP. To help you understand where Oracle's OLAP solutions fit into this spectrum, we will briefly describe each type.
Multidimensional OLAP
With multidimensional OLAP (MOLAP), the data is stored in a multidimensional data store. Both Essbase and Oracle OLAP use MOLAP technology. Essbase stores data in a multidimensional database. Oracle OLAP cubes are multidimensional objects stored in the Oracle Database.
MOLAP cubes are automatically indexed based on the dimensions. Data can be located using offset addressing. To find a given value in a multidimensional array, a MOLAP product needs to use only multiplication and addition, and computers do those operations very fast. MOLAP technology is the best option for dense arrays, where most of the data cells in a cube contain a value. That said, both Essbase and Oracle OLAP have capabilities to manage sparse MOLAP cubes effectively. Figure 1 -2 summarizes MOLAP cube advantages and challenges.
Relational OLAP
Relational OLAP (ROLAP) uses a traditional star/snowflake schema and relational data sources only. With ROLAP, data is neither aggregated nor manipulated. The data is stored in relational tables that can be queried by SQL.
ROLAP is ideal for lower density (sparse) cubes. ROLAP automatically provides all of the advantages of a relational database, such as high availability, replication, read consistent view of data, backup and recovery, parallel processing, and job scheduling

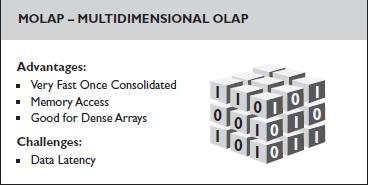
Figure 1-2. MOLAP advantages and challenges
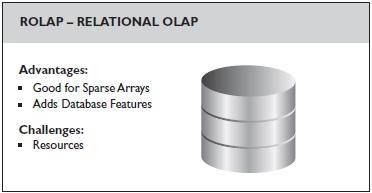
Figure 1-3. ROLAP advantages and challenges
(Note that Oracle Database with Oracle OLAP offers these same advantages within a MOLAP structure.) Figure 1-3 summarizes the advantages and challenges of ROLAP.
Hybrid OLAP
With hybrid OLAP (HOLAP), the data is stored both in an OLAP data store and a relational database. For example, you may have summary-level data stored in the OLAP data store and detailed data stored in the relational database. You could then drill down from the OLAP data store to the detail stored in the relational database.
Today, most OLAP products support the hybrid architecture. Both Essbase and Oracle OLAP can be implemented in this fashion. Figure 1-4 summarizes the advantages and challenges of HOLAP.
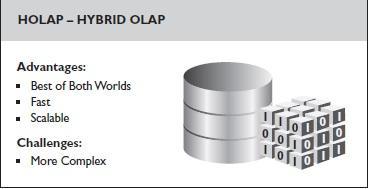
Figure 1-4. HOLAP advantages and challenges
One new extension of HOLAP is called extended OLAP (XOLAP). With XOLAP, you can model metadata such as database outlines and hierarchies in the MOLAP product; however, the data comes from relational sources. Essbase supports XOLAP.
OLAP Products
There are many different types of OLAP products, each of which seeks to provide solutions to certain problems and to meet the needs of particular user communities. While all OLAP products share the ability to support business users with a highly interactive user experience, they can differ significantly in terms of that user experience, performance, analytic capabilities, target audiences, and architecture.
For example, some OLAP products provide a dimensional query model for data stored in relational tables in a way that makes it easier for users to define their own queries and navigate data interactively. Other OLAP products take a fundamentally different approach by tightly coupling data needed with the dimensional model for fast access to the data. This kind of OLAP product differs from one that also provides performance benefits and rich analytical capabilities, and is very different from an OLAP product that is designed to support, for example, a planning and budgeting application.
OLAP with a Data Warehouse
If you already have a data warehouse in place, you can leverage that investment by implementing an OLAP system within or alongside the data warehouse to support BI and performance management activities. Often, a finer level of granularity exists in the data warehouse than in the OLAP system. For example, many of today's implementations are HOLAP systems, where the data warehouse stores the detail data and the OLAP system stores summaries. The OLAP system has ways to allow a user to drill down to detailed data in the data warehouse.
When you implement a middle-tier OLAP system with a data warehouse, data flows from the data warehouse to the OLAP cubes. This is important because the data values in the cubes need to match those in the data warehouse. If you performed all of the data-integration steps for the OLAP system from the original data sources rather than the data warehouse, you would run the risk of the data warehouse and the OLAP environment having two slightly different versions of the data. This could lead to inaccurate analyses and errors.
When you implement a database-centric OLAP system, OLAP data is stored in cubes within the data warehouse itself. The cubes are data objects that can be treated like any other data objects. Connections between summary data and detailed data can be handled by joining a cube to a table.
SQL statements that normally would access a large fact table can be automatically rewritten to access cube-organized views. This greatly increases the performance of the system. Often, a single cube-organized materialized view can replace many table-based materialized views, easing maintenance of the data warehouse.
Typical OLAP Applications
OLAP has been used successfully in a wide variety of applications, including the following:
- Analyzing financial data
- Budgeting and planning
- Forecasting
- Replacing manual spreadsheets
- Accelerating a data warehouse
- Enhancing an enterprise resource planning (ERP) system
- Replacing custom SQL reports
This book includes cases studies - both in this chapter and in Chapter 9 - that provide examples of these typical applications. The case studies are specific to either Oracle OLAP or Essbase.
Now that you have a basic understanding of OLAP, we can turn our attention to Oracle's product offerings. The rest of this chapter focuses on Oracle OLAP and Essbase.
Why Two OLAP Products from Oracle?
With the acquisition of Hyperion Solutions Corporation in 2007, Oracle now owns the two most capable OLAP products on the market: Essbase and Oracle OLAP. While both products fall within the OLAP category and have some similar capabilities, they are different in significant ways. One purpose of this book is to show how the products are the same and how they differ, so that you can choose the solution that best suits your environment.
Similarities Between Essbase and Oracle OLAP
Both Oracle OLAP and Essbase have the capability of storing data in OLAP cubes. As such, they share the following capabilities:
- Excellent performance for queries that require summary-level data
- Fast, incremental update of data sets, which is required to facilitate frequent data updates
- Rich calculation models that may be used to enrich analytic content
- A dimensional model that presents data in a form that is easy for business users to query and define analytic content
Because both Essbase and Oracle OLAP provide these core capabilities, it might seem like they are similar enough to be interchangeable. This is not the case. Each product focuses on delivering OLAP capabilities into different types of applications and for different classes of users.
Differences Between Essbase and Oracle OLAP
Essbase and Oracle OLAP are two of the leading OLAP solutions. However, the products have taken different paths based on the product strategies of Hyperion and Oracle and the roles that each product fulfills. From the mid-1 990s to 2007, Hyperion focused on building solutions for the middle tier. Oracle spent the same period embedding an OLAP engine into its world-class database. Most of the differences between Essbase and Oracle OLAP derive from the fact that Essbase is a separate process, while Oracle OLAP is an option to the Oracle Database Enterprise Edition.
Essbase: Separate-Server OLAP
As noted, Essbase comes from a history of OLAP applications based in the middle tier. The strategy of Essbase centers on custom analytics and BI applications with a focus on EPM. This strategy addresses the what-if, modeling, and future-oriented questions that companies need answered today in order to see into the future.
Typically, Essbase applications are started and maintained by business analysts. The buyer is usually in the line of business. The typical end users are line-of- business users, such as analysts in the finance, marketing, and sales departments, who query and create data with Essbase tools and Oracle Hyperion applications. The line of business typically has a large degree of uncertainty and needs to understand a dynamic and changing environment.
Essbase is the OLAP server that provides an environment for rapidly developing custom analytic and EPM applications. The data management strategy allows Essbase to easily combine data from a wide variety of data sources, including the Oracle Database. Essbase is part of the Oracle Fusion Middleware architecture.
Oracle OLAP: Database-Centric OLAP
Oracle OLAP is available as an option to the Oracle Database Enterprise Edition. As an embedded component of the Oracle Database, Oracle OLAP benefits from the scalability, high availability, job scheduling, parallel processing, and security features inherent in the Oracle Database. With Oracle OLAP, all of the data resides in an Oracle database, governed by centralized data security and calculation rules.
An SQL interface to OLAP cubes allows SQL-based applications to query cubes within an Oracle database, and benefit from the performance and analytic content of the OLAP option. The primary data-access language for Oracle OLAP is SQL, making Oracle OLAP a natural choice for enhancing the performance and calculation capabilities of an existing Oracle data warehouse.
OLAP Business Case Studies
To get a sense of how the two Oracle OLAP solutions differ in a real-world setting, let's take a look at some case studies.
Essbase Case Studies
For the Essbase case studies, we examine a major airline and a major food processing company.
Airline Case Study
After the terrorist attacks of September 11,2001, a major airline faced a crisis. Management needed to project cash flows in the face of extraordinary uncertainty about customer travel plans, fuel prices, new security regulations, and other variables in the wake of tragedy. The solution was implemented with alternative cash flow scenario models, capital spending plans, 15-month rolling forecasts, and "business cockpits" (multidimensional dashboards). The buyer was the vice president of the finance department, and the user community consisted of business users in finance, reservations, and ground operations.
Key to survival and success was determining how long cash balances of $1 billion would last based on immediately deferred capital spending, halted discretionary spending, and borrowing $400 million on an existing line of credit. The answer depended on return in revenues.
On September 11, Essbase enabled airline personnel to model many scenarios that provided the moral support, comfort level, and confidence for the many departments working hard to make it through that fateful day and the days that followed. Within five days, they were able to set up all scenario models, and they could forecast within 2 percent of outcome entirely in Essbase, providing top-to- bottom and bottom-to-top analysis capabilities.
Essbase performed very well. Queries that would have taken at least four hours to write, run, gather data for, enter on a spreadsheet, and analyze were instead accomplished in one minute with Essbase. Before Essbase, the finance department was spending 75 percent of its time accumulating data and 25 percent of its time analyzing. With Essbase, those ratios are now 10 percent and 90 percent, respectively.
Airline Case Study Summary
Business problem Needed to project cash flow in the face of extraordinary uncertainty about customer travel plans, fuel prices, new security regulations, and other variables after 9/11
Solution Alternative cash flow scenario models, capital spending plans, 15-month rolling forecasts, and "business cockpits" (multidimensional dashboards)
Buyer VP of finance department
User community Business users in finance, reservations, and ground operations
Food Processing Company Case Study
The food processing company is one of the world's largest providers of luncheon and deli meats. The company employs more than 1,000 people and distributes its products across all 50 states, as well as exporting to Mexico and Puerto Rico. It has three distribution centers in the United States, and sells its products through the largest grocery and mass merchandizing chains in the country.
The company had a requirement to do marketing lift analysis. For example, if the company launched a coupon campaign, the marketing managers needed to determine what the sales lift was by product. They wanted to know how the campaign affected sales over the life of the campaign, in addition to calculating the return on investment (ROI) of the campaign. They also needed to integrate data from a number of sources: third-party data, data from legacy systems, ERP data from JD Edwards (JDE), and data stored in multiple SQL Server databases. They evaluated a number of prepackaged solutions for marketing analysis and determined that their requirements were unique enough that a custom solution was required.
The food processing company implemented a custom solution of Essbase in less than two months and can now analyze its campaign performance effectively.
Food Processing Company Case Study Summary
Business problem Visibility into marketing campaign effectiveness
Solution Marketing analysis application that integrates internal data from JDE and SQL Server with external demographic feeds, calculates percentage lift of marketing promotions, and identifies advertising ROI by campaige
Buyer Marketing department (also used in finance)
User community Managed by marketing analysts; accessed by marketing and advertising managers
Oracle OLAP Case Studies
For the Oracle OLAP case studies, we present a major automotive manufacturer and a management consulting and research company.
Automotive Manufacturer Case Study
The challenge for the management of the automotive manufacturer was to analyze energy-consumption patterns within an automotive assembly plant, with the goal of rescheduling peak usage to coincide with times of day and with lower per-unit costs. The solution was to consolidate energy-meter readings in an Oracle data warehouse, including OLAP cubes utilized for time-series analysis. The buyer of Oracle OLAP was the IT department. The user community was the line-of-business users at product unit and cost center levels. They queried the Oracle data warehouse with the OLAP cube utilizing BusinessObjects Web Intelligence and Oracle Business Intelligence Spreadsheet Add-in.
The company faced the following challenges when approaching this problem:
- Enable automated and manual collection of detailed transactional data from the factory's many energy meters.
- Enable near real-time analysis of energy consumption, requiring frequent and rapid update of the data warehouse.
- Enable detailed analysis of past energy consumption.
The IT department, in consultation with the line-of-business users, implemented Oracle OLAP. They consolidated and centralized data sources using Oracle Database 10g and Oracle Warehouse Builder (OWB), enabling rapid data aggregation and near real-time analysis of energy usage. This allowed line-of-business users at the production unit and cost center levels to rapidly analyze data using Oracle OLAP, BusinessObjects Web Intelligence, and the BI Spreadsheet Add-In.
Automotive Manufacturer Case Study Summary
Business problem Analyze energy-consumption patterns within an automotive assembly plant, with the goal of rescheduling peak usage to coincide with times of day with lower per-unit costs
Solution Consolidate energy-meter readings in an Oracle data warehouse, using OLAP cubes for time-series analysis
Buyer IT
User community Line-of-business users at product unit and cost center levels, who query the Oracle data warehouse with OLAP cubes using BusinessObjects Web Intelligence and BI Spreadsheet Add-in
Management Consulting and Research Company Case Study
A management consulting and research company provides healthcare satisfaction metrics to thousands of healthcare providers, based on survey data from tens of thousands of patients per year. Because of the volume of data and privacy issues, the company requires a data infrastructure that is highly scalable, reliable, and secure. The data must be accessible to a wide variety of applications, including SQL-based BI applications.
This company's IT organization implemented an infrastructure that uses an Oracle data warehouse, including Oracle OLAP, to achieve a highly scalable and secure solution with time series and other analytic features. The goal was to gain the ability to support BI applications without replicating large amounts of data in specialized analytical databases.
The Oracle-based data infrastructure supports more than 1,000 concurrent users, without compromising performance, reliability, or security. The solution provides rapid response time for a custom SQL-based application, even for large documents that contain more than 20 thumbnail graphs and 20 cross tabulations per page (as many as 40 queries per page view).
Management Consulting and Research Company Case Study Summary
Business problem Allow a large user community of third-party health providers to analyze healthcare satisfaction polling data
Solution Consolidate healthcare satisfaction survey data in an Oracle data warehouse using OLAP cubes Custom SQL-based reporting application relies on the cube for required analytics and fast query response
Buyer IT
User community 1,000+ concurrent third-party healthcare providers querying OLAP cubes
Architecting the Appropriate OLAP Solution
The case studies reveal how assessing an organization against a set of standard criteria can help determine the best OLAP solution for that environment. Here are five questions you can ask to help assess your own organizational needs in terms of those criteria:
- What is the purpose of the application?
- Who is the buyer of the application, and who will support it?
- Who are the end users, what needs do they have, and what tools will they use?
- How will the application acquire and manage data?
- Does a middle-tier or database OLAP architecture serve the organization best?
This section guides you in selecting the OLAP solution for your organization and describes the types of OLAP implementations that are available.
Choosing the Solution That Meets Your Needs
Table 1 -1 compares and contrasts Essbase and Oracle OLAP based on the five criteria: purpose, buyer, typical end user, data management strategy, and architectural needs.
Better Together
Both Essbase and Oracle OLAP provide powerful OLAP solutions. They are not, however, mutually exclusive. When implemented together, they can form a complete OLAP solution.
Essbase provides a platform for EPM and pervasive BI. Oracle OLAP is a powerful enhancement to a data warehousing environment. Better together, the two OLAP solutions provide complementary benefits for a complete OLAP solution.
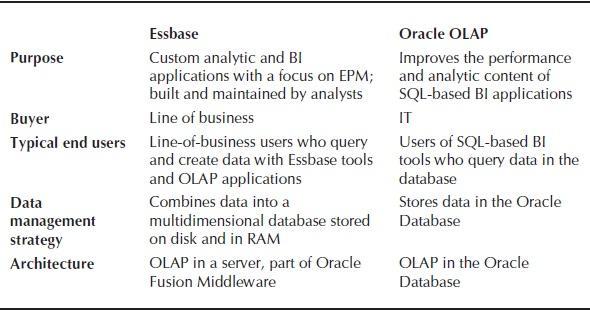
Table 1-1. Comparison of the Two Oracle OLAP Solutions
Conclusion
Essbase and Oracle OLAP share common characteristics such as excellent query performance, fast update, rich analytic content, and a dimensional model.
However, the products have different users and uses. Essbase is designed for line-of-business users and is focused on EPM applications. Oracle OLAP is part of the Oracle Database and is designed so that IT can support the needs of business users directly from the database or data warehouse. Implemented together, their capabilities provide a complete OLAP solution.