 In this blog and the next, we will cover executing and implementing Oracle Endeca Information Discovery. We will cover some of the use cases discussed in the previous articles and walk through the implementation details. The use cases in this book leverage public data sets with some modifications for illustration purposes. The focus of this blog is voter fraud analytics and detection, and you can obtain the data sources used in this use case through data portals of various government agencies. We have modified some records to illustrate abnormality analysis and detection. They do not reflect or indicate real-world occurrences of fraud, and the use case by no means indicates there were actual occurrences of voter fraud in the municipality and counties where the data originated.
This blog first gives an overview of the voter fraud use case and then breaks down the implementation steps into two parts: election results analysis to confirm alleged fraud and a deep dive into voter records to look for potential fraudsters.
Overview of Voter Fraud Analytics and Detection
To date, a majority of U.S. states have prosecuted voter fraud. In some cases, people who committed the fraud might have done so unintentionally and were not aware of their ineligibility. For example, recently a former drug offender in Iowa was acquitted of perjury of voter fraud, an offense that could lead to 15 years in prison upon conviction. The jury found her not guilty and considered it an honest mistake when she cast a ballot under the belief her voting rights had been restored after leaving probation. While unintentional mistakes exist, there have been many controversies in recent years regarding the pervasiveness of intentional election fraud, especially in tight races.
There are various forms of election fraud. Large-scale fraud often occurs prior to the election. This includes electoral and demographic manipulation, voter intimidation, disenfranchisement, and vote buying. It is also believed that there are considerable numbers of deceased voters who still remain on the rolls across the country. In addition, some counties have more registered voters than residents because in some areas people voted more than once in the same county or in different states.
This use case originated from allegations that there had been potential voter irregularities in a certain county. You will first examine a simple data source for recent election results. The election results are public records, and they usually include aggregated counts of voter turnout versus registered voters, as well as election results based on precinct. This is a good starting point to understand the outcome of the election and what potential fraudulent activities might exist. As you discover and confirm potential anomalies, you will then drill into detailed voter records, including voter demographic information, location and addresses, and voting history. You will enrich this set of detailed voter records with additional data sources from live statistics and property tax records in nearby regions. We will take you step by step through how you would explore these separate data sources and how you would integrate and analyze them to discover potential fraud.
Election Results Analysis
Let’s start with a simple election results data feed from the Secretary of State web site. Here are the columns this use case will use:
- County Number The number assigned to a county within the state.
- Precinct Name The name of the precinct. This is the level where the aggregation of registered voters and total voters for an election is tallied.
- Election Date The date when the election was held.
- Election Type The type of election such as primary, general, or special.
- Registered Voters The total number of registered voters in the precinct.
- Total Voters The total number of voters who voted on that election date.
Figure 1 shows a sampling of the data sheet.
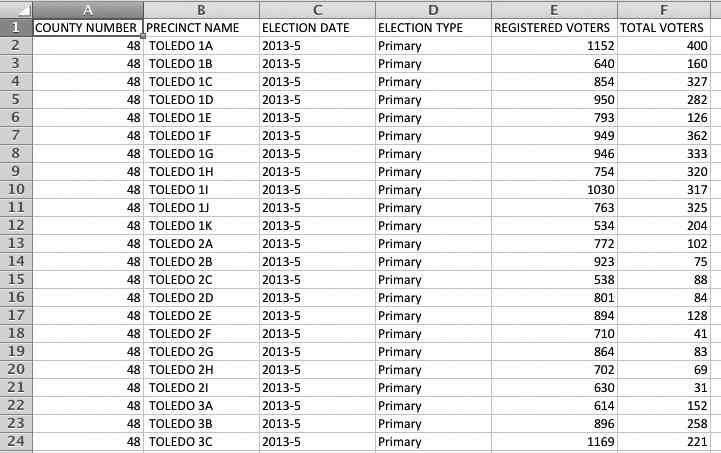
FIGURE 1. Election result data set snippet
In this use case, we will walk you through using the Provisioning Service within Oracle Endeca Infor mation Discovery Studio to create a simple application with this data source. The following sections cover the step-by-step instructions on how to accomplish this.
Step 1: Launch Endeca Studio and Create a New Application
Figure 2 displays the Endeca Studio home page, which lists the available Information Discovery applications. The last icon allows you to create a new application.
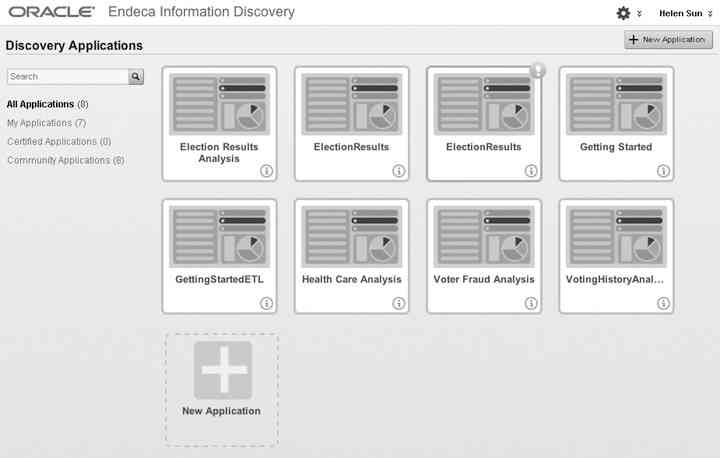
FIGURE 2. Endeca Studio home page
Step 2: Enter the Application Name and Description and Select a Data Source
After you click the New Application icon, you enter the application name and description on the New Discovery Application screen. (Application description is an optional field.) There are two file format options available: Excel or JSON. In this case, we are choosing Excel; then the Select a file option appears that allows you to navigate to the file location, as shown in Figure 3.

FIGURE 3. Creating a new Information Discovery application
After you select a file, Endeca Studio will parse the file content and display the data it contains in a window, as shown in Figure 4.
FIGURE 4. Data set display in Endeca Studio
Step 3: Review and Modify Metadata
After clicking Next in the top-right corner of the screen, the metadata of the file will be loaded. We’ll keep the default settings of all the field names and data types in this case, as shown in Figure 5.

FIGURE 5. Data set metadata screen in Endeca Studio
Step 4: Create the Application
Upon clicking Done, Endeca Studio loads the data set and creates an Information Discovery application, as shown in Figure 6.

FIGURE 6. Default Information Discovery application
Step 5: Start Exploring Data
The default layout in an Endeca Information Discovery application is a two-column panel, as shown in Figure 6. The left panel has a search box and refinements. The search box works just like Google. When the user enters a search item, the “type-ahead” hint will be displayed to allow the user to select a matching attribute value or to search on the text entered.
Selected Refinements tracks the filters applied through the search or refinement section. It creates a breadcrumb that enables the user to track, add, or remove the applied filters.
The Available Refinements section displays attributes available for filtering. Endeca Studio automatically clusters the attribute values and displays the most applicable filtering options, as shown in Figure 7.

FIGURE 7. Available refinements
The results table lists records for the current refinement. You can also configure the result table to display a set of metrics aggregated by one or more dimensions.
Step 6: Discover Insights
The first thing you can do as you continue exploring the election result data set is to configure the chart component in the top-right section of the page. As you mouse over the gear icon on the top-right corner of the chart, the “option” hover text will appear. Click the gear icon to configure the chart. You will see four tabs on the chart configuration screen that appears: Data Selection, Chart Type, Chart Configuration, and Style Options. The Data Selection tab is prepopulated, and we will keep the default settings for this use case. Click the Chart Type tab, select the Bar-Line type, and choose Single axis, as shown in Figure 8.
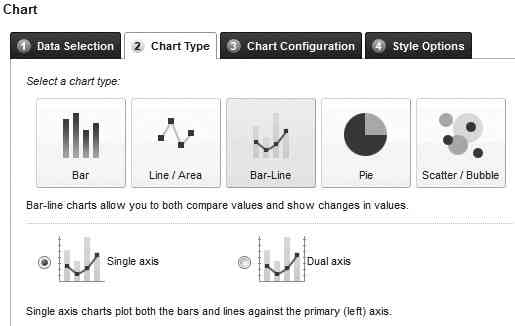
FIGURE 8. Chart type selection
On the Chart Configuration tab, select the sum of Registered Voters in the bar section of Series Metrics and the sum of Total Voters for the line display. Also, remove all other attributes from the Dimensions section except for Precinct Name. Figure 9 shows the final selection and configuration.
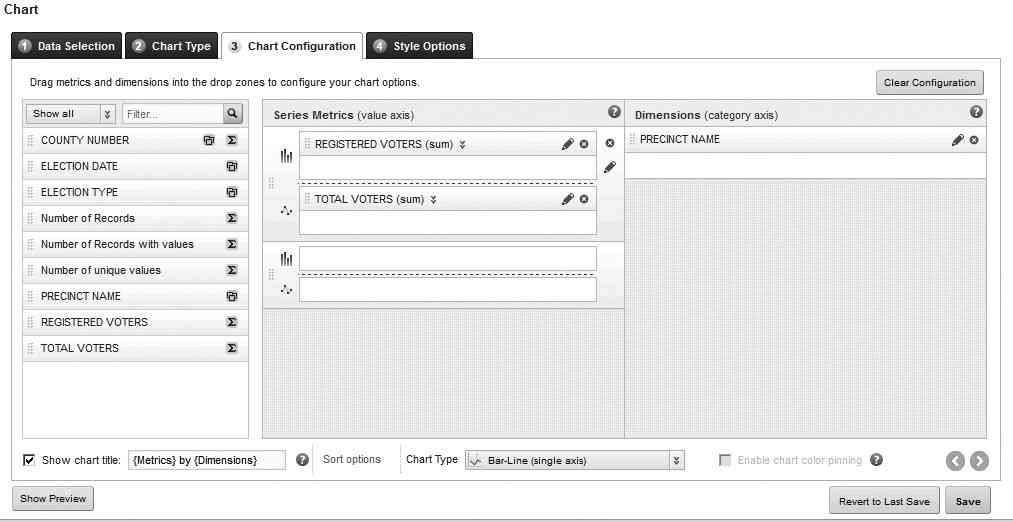
FIGURE 9. Chart configuration
Then click Save and Exit. Endeca will take you back to the application screen with the newly configured chart displayed, as shown in Figure 10.

FIGURE 10. Election results chart
As you navigate from page to page, you are able to determine the voter turnout from precinct to precinct. On page 2 of the election result chart, notice that one of the counties has more voters in the November election than the total registered voters, as shown in Figure 11.

FIGURE 11. Comparing total voters and registered voters
A Deeper Dive of Voter Records
To further investigate, we’ll need to incorporate additional data sources, including voter records, live statistics, and property tax records from various state and county recorders’ offices. The tool of choice in this case is Endeca Integrator ETL because you need to join several data sources for analysis.
Data Sources
In addition to the election results data set we loaded through the Endeca Provisioning Service in the previous section of this blog, in this section, we will include new data sets for a more in-depth analysis of voter records. You can do the initial exploration of these new data sets through Endeca Provisioning Service as well. When you add a new data set using Provisioning Service, Endeca Studio will automatically create a new tab in the application with the default page layout.
Voter Records This data set contains details on registered voters, including demographic information, location data with both residential address and mailing address, voting history, and party affiliation. You can add a tag cloud for the mailing address’s city and state on the Voter tab, as shown in Figure 12. It provides a view of the mailing address’ city and state range for the voters. It is not surprising to see the city of Toledo has the majority of record counts since this hypothetical case is in Lucas County, Ohio, but the other cities such as Chicago and Cleveland give you a hint of which subset of data to load for the property ownership of these voters.
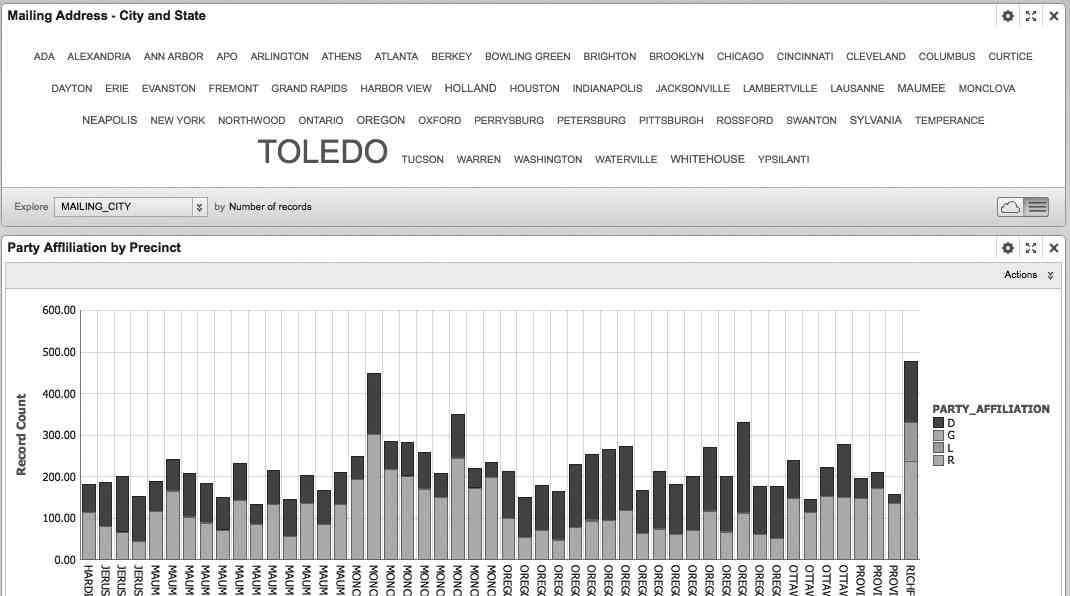
FIGURE 12. Voter details
The chart component (below the tag cloud) in Figure 13 shows voter party affiliation for each of the precincts. Notice that the rightmost precinct has a significant number of Libertarians. If you change the chart setting to show all precincts instead of the default of 50, you see an interesting picture in Figure 13, which gives you a good view of the voter party affiliation breakout within this county by precinct. Even though the goal is to analyze election anomalies, you are able to obtain an unexpected discovery of the data set that could be used for future campaign initiatives. Also, note that this chart does not show Independent voters. In this data set, the column Party Affiliation is null for the voters who didn’t vote in primaries and didn’t declare a party affiliation. You’ll fix that later in this use case.

FIGURE 13. Voter party affiliation
Live Statistics The live statistics records contain information including name, age at death, birthday, and date of death, as shown in Figure 14. Note that the Name field is a concatenation of last name and first name divided by a comma. You will use this data set to look for any occurrences of votes being cast from deceased voters by fraudsters.
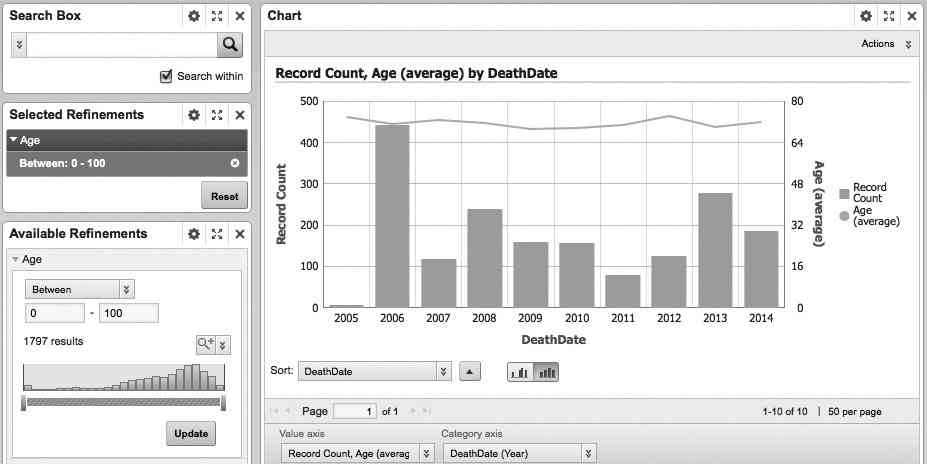
FIGURE 14. Live statistics data set
Property Tax Information Property tax information, as shown in Figure 15, can be obtained through the county treasury and assessor office.
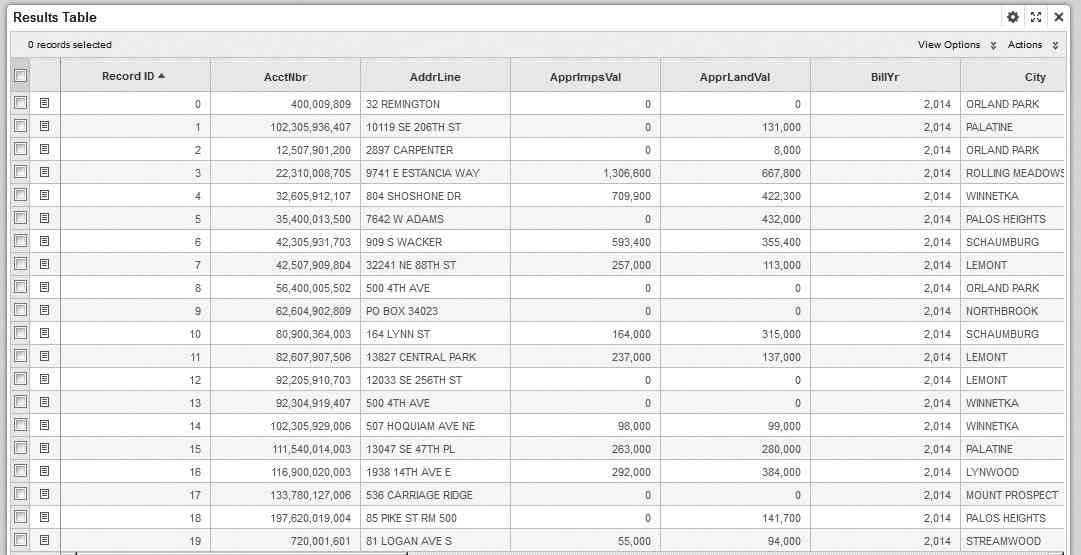
FIGURE 15. Property tax data set
In addition to the property account number and address, other information in this data set includes first name, last name, tax status, new property status, and tax valuation. You will leverage this data set to look for voters who might have primary residence status in other states outside of the county where they have cast votes in past elections.
Integration
Let’s use Endeca Integrator ETL to load the data set into a data domain on the Endeca Server instance called VoterFraud. We will walk you through the necessary steps to design, develop, and run an ETL job within Endeca Integrator ETL for this use case in the following sections.
Step 1: Create a New Project and Configure the Project Workspace You have two options for creating a new project. The first option is to select File | New | CloverETLProject. The New CloverETL Project dialog will open, as shown in Figure 16.

FIGURE 16. Creating a new CloverETL project
The second option is to duplicate an existing project by right-clicking and using the copy and paste options. As an alternative to duplicating the entire project, you can copy and paste individual components from one project to another. This is the recommended approach for modifying the workspace parameter file. Figure 17 displays the contents of the workspace file.
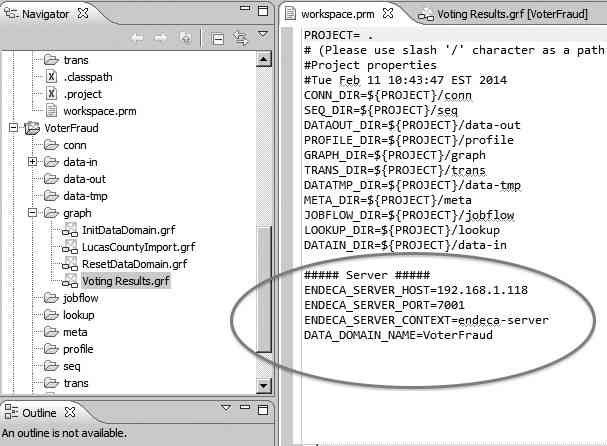
FIGURE 17. Workspace settings
In the Server section of the workspace file, you specify parameters for the Endeca Server hostname or IP address, server port, server context, and name of the data domain. As you’ll see in the later steps, these project-level variables will be referenced many times in various graph components, and specifying them here avoids hard-coding these parameters in different components.
Step 2: Import Data Sources You can import data sources into an Integrator project in a number of ways. The easiest is to drag a file from its file system location to the data-in folder in the navigation panel on the left side of the screen, as demonstrated in Figure 18.

FIGURE 18. Importing data sources
Underneath the data-in folder are the data sources included in this project.
Step 3: Create Graphs To create a new graph, right-click the Graph folder in the navigation panel on the left of the screen, select New, and select ETL Graph. A new graph definition window will appear, as shown in Figure 19. You can name the graph VotingResults and enter a meaningful description for documentation and reference purposes. Below the Description field, leave the Allow inclusion of parameters from external file? box checked based on the default setting. You can also keep the default location and filename for the workspace parameter file. This will ensure the project variables defined in the workspace file from the previous step can be referenced in the components of this graph.

FIGURE 19. Creating a new ETL graph
Alternatively, you can copy and paste existing graph objects from other projects. This is what we will show how to do with the InitDataDomain and ResetDataDomain graphs. You simply copy and paste the same two graph files from the GettingStarted project downloaded from Oracle Technology Network. These graphs and projects have followed the best practice of using global project variables instead of hard-coding server configuration information in the individual components. As a result, you do not have to reconfigure the components to point to the server and data domain for this project. Figure 20 shows an overview of the Data Domain Property settings.

The InitDataDomain graph, as its name suggests, is the first step in the data loading process. This step checks for the existence of this data domain on the Endeca Server instance and either creates or enables the data domain based on the result of the check (see Figure 21).
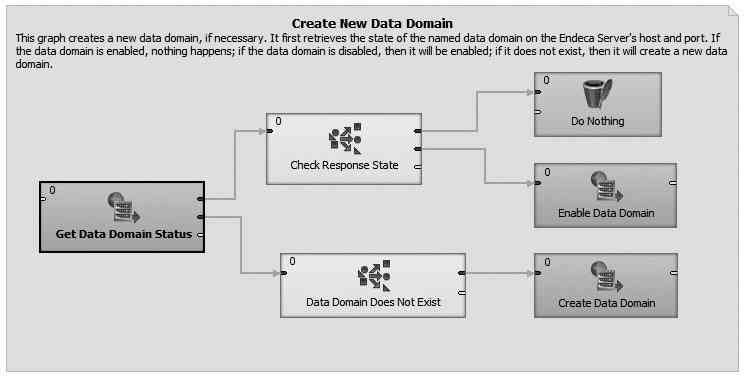
FIGURE 21. InitDataDomain graph design
The ResetDataDomain graph will erase everything in the data domain, including the data and configuration.
The new VotingResults graph will display an empty palette in the middle section of the screen. We will be creating readers, transformers, joiners, and writers in this graph. To create a data reader, you can select a reader type from the component panel on the right side of the project screen. Another method is to simply drag and drop the input file in the Data-in folder onto the graph design palette. Endeca will create a reader automatically based on the input file type. You can use this method to create data readers for each of the four input files in this project. To modify the properties of the reader component, you right-click the reader and select Edit from the pop-up menu. The property window will be displayed for editing purposes.
Metadata is an important component in an ETL project. In a graph design view, the Outline window displayed in the bottom-left corner of the screen contains the Metadata folder. There are a couple of ways to create metadata. One convenient method is to drag an input file in the Data-in folder into the Metadata folder in the Outline window. Endeca Integrator ETL will automatically extract the metadata from the input file that you can further define or modify, as shown in Figure 22.
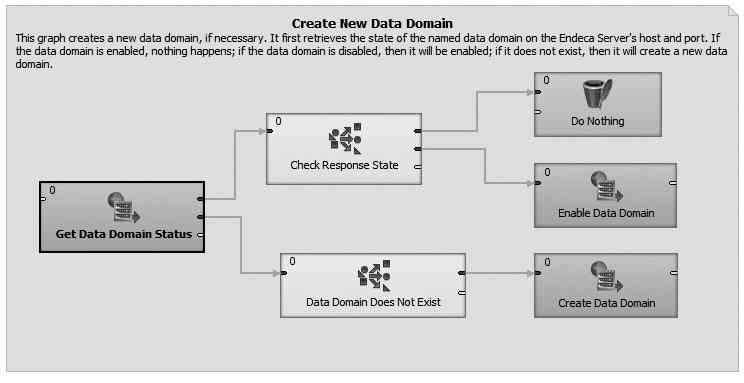
FIGURE 22. Extracting metadata
Numerous metadata files are being created and extracted throughout the graph steps, so it’s important to provide a meaningful name for the metadata file each step of the way to avoid complexity in the debugging process.
You can use the Reformat component from the Transformers library, available in the right palette, to create transformations that change the string capitalization, concatenate columns to form full names, and replace null values with default values. When you right-click the Reformat component and select Edit, you will be able to click the Transform button to further define the transformation details, as shown in Figure 23.
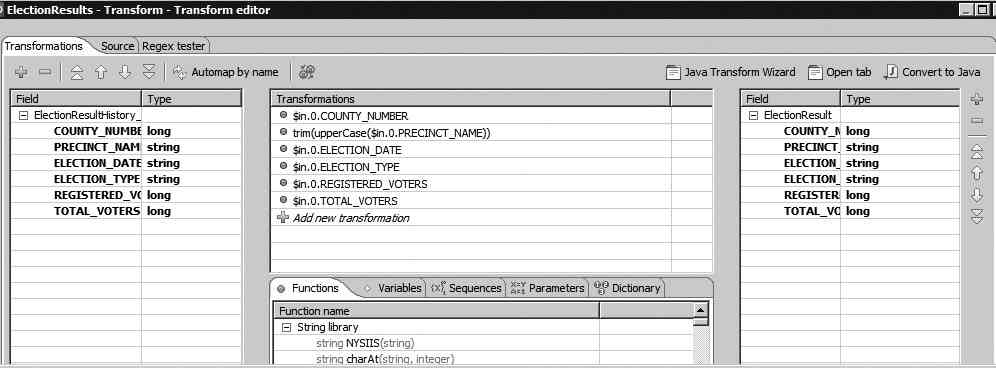
FIGURE 23. Defining transformation details with the Reformat control
The EXT_HASH_JOIN is used to define the join condition of different data sets and map input attributes to output attributes (see Figure 24).
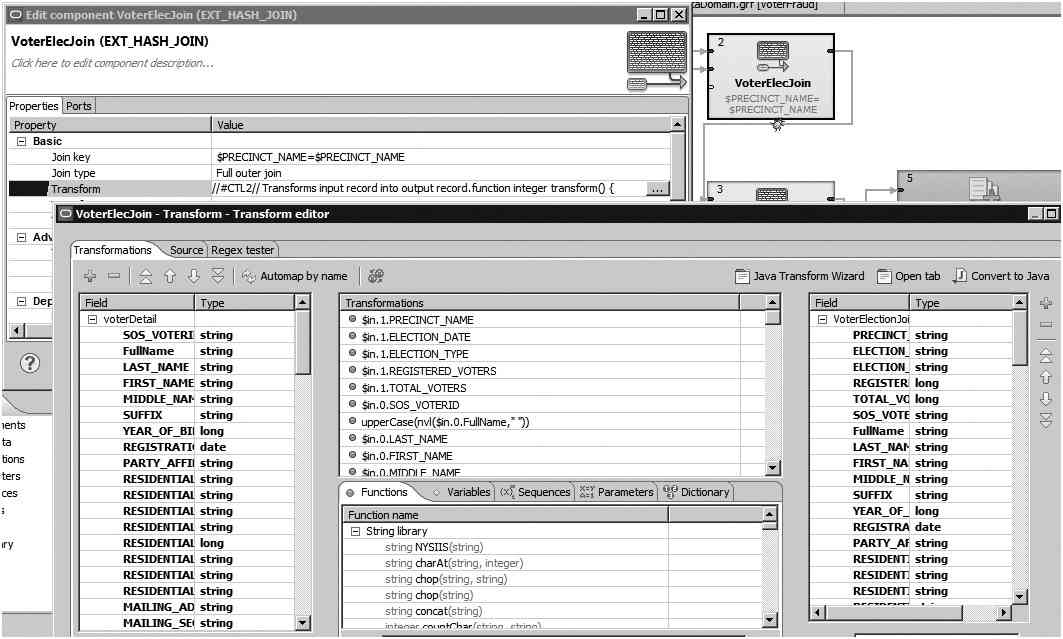
FIGURE 24. Using EXT_HASH_JOIN control to join data sets
You can choose different join conditions (inner, left outer, and full outer), depending on the requirement and data sets, and you can apply additional transformation as needed through the middle section by selecting from the multitude of built-in functions Endeca provides, or by inputting the condition directly in the script window. Endeca will check the validity of the condition and provide feedback if the syntax entered is incorrect.
The last component of the graph is the Bulk Load to Data Domain control from the Writers library. Figure 25 shows the configuration screen when you right-click the control and select Edit.

FIGURE 25. Configure Bulk Load to Data Domain control
As mentioned earlier, you specify the project variables in the configuration settings for the server name, port, context, and data domain name. Endeca will extract the variable values defined in the workspace file shown earlier in Figure 17 at run time. Figure 26 shows the final product of the ETL graph design view.
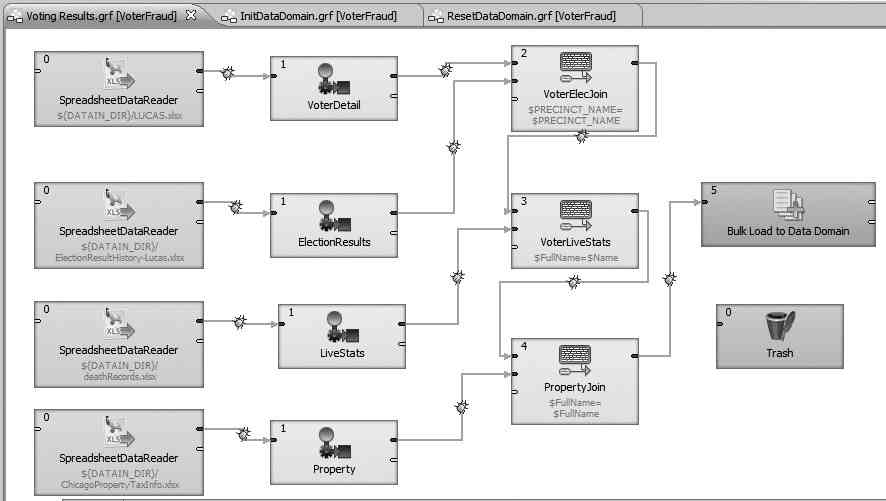
FIGURE 26. VotingResults graph design view
The lines that connect Reader components to the Formatter to Joiner components and eventually to the Writer component are called Edge lines in Endeca Integrator ETL; they are available in the top-right corner in the Palette window. For each of the Edge lines, you can apply metadata by right-clicking the dotted line when the Edge line is initially created. Once a metadata file is selected and applied to the Edge line, the dotted line will turn into a solid line.
You can use two useful tools to help you debug the ETL process: debug mode and the Trash component. The bug icon on the Edge line indicates that the step is run in debug mode. This can be activated by right-clicking the Edge line and selecting Enable Debug. With debug mode enabled, you can view the data output for that step during run time. The Trash component is also useful for debugging during ETL development. It simply replaces the writer and allows you to view the output result during the design and testing stages. Please note that the unused components on the ETL graph need to be disabled during the test runs.
The small numbers displayed in the top-left corner of the controls are to specify the run sequences. These numbers ensure the dependent steps are completed before the next steps can be run.
Step 4: Run Graphs You’ll want to run the graphs in the following order:
- Initialize Data Domain (provisioning a new data domain, if necessary)
- Reset Data Domain (clearing all data, schema, and config from the data domain)
- Load Voting Data (loading voting data into the data domain)
The run time information will be displayed in the console window below the graph designer, as shown in Figures 27 and 28.

FIGURE 27. Run time output for InitDataDomain graph

FIGURE 28. Run time output for VotingResults graph
As the integrated voter data is loaded into the Endeca Server VoterFraud data domain, you can now create a new application in Endeca Studio.
Voter Fraud Application Walk-Through
You are now back at the Endeca Studio interface to create a new application called Voter Fraud Analysis. Instead of using the Upload a File option, you can choose the Use a Pre-built Endeca Server and select the VoterFraud data domain in the drop-down list. Endeca Studio will create a default application based on the data source selected.
You can configure the same bar chart as shown in Figure 13, but you get a very different view in Figure 29 when converting the null value in the party affiliation column to “I” (for “Independents”) through the transformation function within Endeca Integrator ETL. You can also accomplish this through the Provisioning Service in Endeca Studio.

FIGURE 29. New party affiliation spread with Independents
Back to the fraud analysis: You can create a new chart to display out-of-state property and death record matches, as shown in Figure 30.
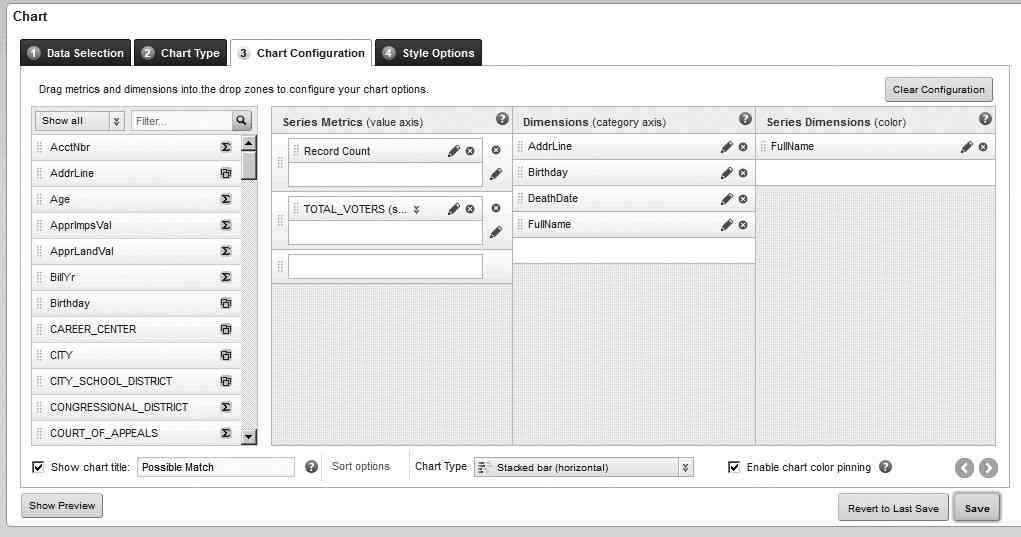
FIGURE 30. Chart configuration for possible match
First, you use Record Count as the Value axis and AddrLine for the Category axis. The AddrLine attribute is from the property tax data source. You use a left-outer join in the joiner component in Endeca Integrator ETL so that all the voter records will be preserved, but only those property records that have a match in the voter record set will be included. This behaves much like a left-outer join in a traditional ANSI SQL statement. You also choose FullName in the Color selection to enable the full names being displayed on the chart, along with their out-of-state property addresses. Figure 31 displays the individuals who have indicated having residential addresses in one of the precincts of the county you are examining and have out-of-state properties claimed as primary residence in their tax records. The fact that these registered voters have out-of-state properties does not automatically lead to fraud. However, it provides a direction for further investigation.

FIGURE 31. Out-of-state property matches
Next, take a look at the record match from the live statistics data set. You can simply use the same chart and change the dimension selection to Death Date. Since there are quite a number of deceased records matching your voter data, you apply the precinct filter to narrow down the list to three, as shown in Figure 32. The precinct you have chosen is from the hypothetical discovery in the earlier section of this article, where more voters have been reported than the total number of registered voters.

FIGURE 32. Deceased records matches
Out of the three records, one individual passed away in February 2014. The elections we are investigating occurred prior to the date, so you can focus your attention on the other two individuals. Click the record of one of the individuals in the chart. Endeca Studio automatically adds the filter to all the components on the page, as shown in Figure 33.
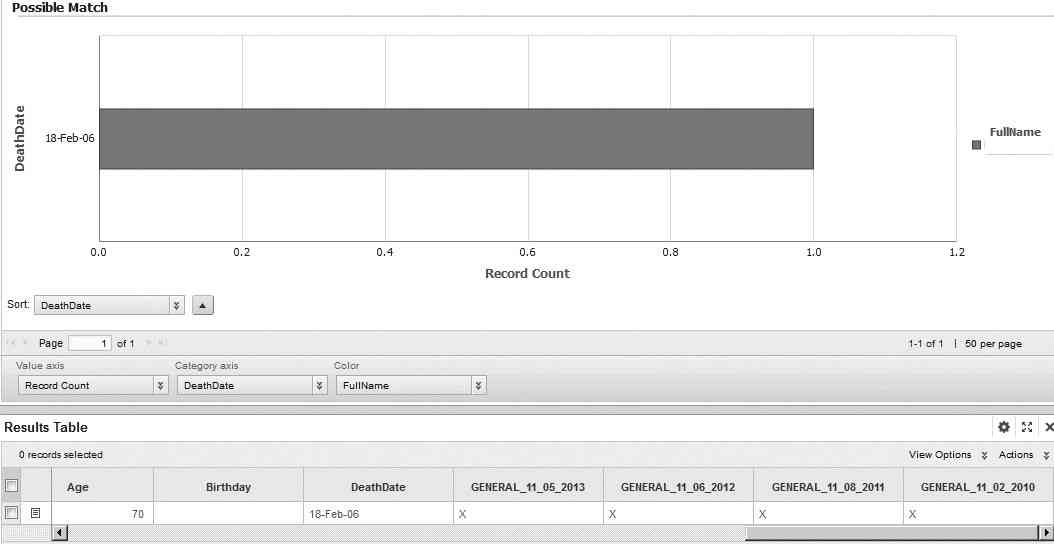
FIGURE 33. Deceased person voting
As you can see in the result table and chart of Figure 33, this individual passed away in 2006 but continued to vote in the recent elections, including 2010, 2011, 2012, and 2013.


