 Companies in different sectors may not share core business strategies. They are also likely to focus on different aspects of their businesses to improve efficiency and drive revenue. However, there is a set of use cases that is applicable to the majority of companies. This includes use cases in the areas of sentiment analysis, brand reputation management, human resources and retention analytics, and financial analytics. For companies and government agencies that are public facing and consumer or citizen focused, customer churn prevention is also a common analysis that plays a crucial role in expanding market share, increasing revenue, and improving profit margin.
Brand Reputation
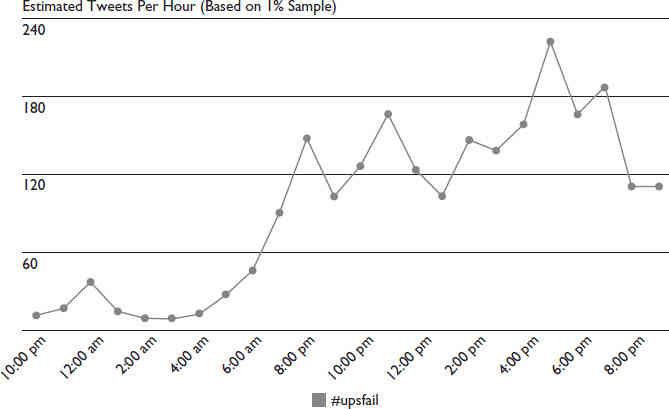
During the last shopping weekend before Christmas 2013, web sales jumped 37 percent from the prior year according to the Wall Street Journal. E-commerce revenues of holiday season 2013 from November to December grew by 10 percent, reported CNBC, buoyed by an 18.2 percent increase on Cyber Monday, amid slow mall traffic and weak sales at brick-and-mortar retailers. Thousands of Americans awoke to find that special something missing from beneath the Christmas tree on Christmas morning, a day after UPS acknowledged getting swamped by the seasonal cheer and failing to deliver orders in time. Many disappointed consumers took their complaints to social media and adopted the hashtags #UPSFail and #FedExFail on Twitter to lodge complaints or just to find a sympathetic ear. Figure 1 shows a sample trending graph from a sentiment analysis company called hashtags.org.

FIGURE 1. Trending graph over 24 hours for #UPSFail
Figure 1 is a perfect example of our first use case: sentiment analysis and brand reputation monitoring. The popularity of social media such as Facebook and Twitter gives rise to sentiment analysis, also known as opinion mining. In the wake of the unexpected online volume, companies such as UPS and FedEx are closely monitoring the social media space to reach out to disgruntled customers, especially those with high social influence. Some sample tweets in Figure 2 illustrate how this relationship evolves and negative sentiments turn into mutual understanding with real-time communication from the company service representative to the customers.

FIGURE 2. Sample tweets on #UPSFail
The application to monitor social media space is straightforward to build. Twitter provides a set of streaming APIs with low-latency access to Twitter’s global stream of tweet data. Companies can use these APIs to create applications and dashboards to enable public relations and marketing analysts to monitor and manage brand reputation. Many companies also combine this information with their point-of-sale (POS) and marketing campaign data to correlate sentiment with campaign results and sales outcomes. Many social media analytics firms have emerged in recent years. These firms specialize in benchmarking systems that score a brand performance on major social media properties based on different metrics, including tags, comments, and views. These analytics provide a more complete picture of a brand’s social influence across various social channels than simply the number of likes or followers amassed. Some of the companies we looked into are leveraging these package solutions to manage, monitor, and outreach to their customers in the social space for improved brand loyalty and influence.
Human Resource
Human resource (HR) management does not involve a large amount of data. The typical HR events include hiring, promotion, and termination activities. They usually reside in financial, HR, and data warehouse systems that are curated and maintained by IT organizations. The challenge with HR analytics lies in the difficulties of consuming unstructured data, including employee survey data, and blending it with historic HR event data. The ability to analyze and integrate raw text comments from employees can provide unprecedented insights into the overall job performance of managers as well as team dynamics.
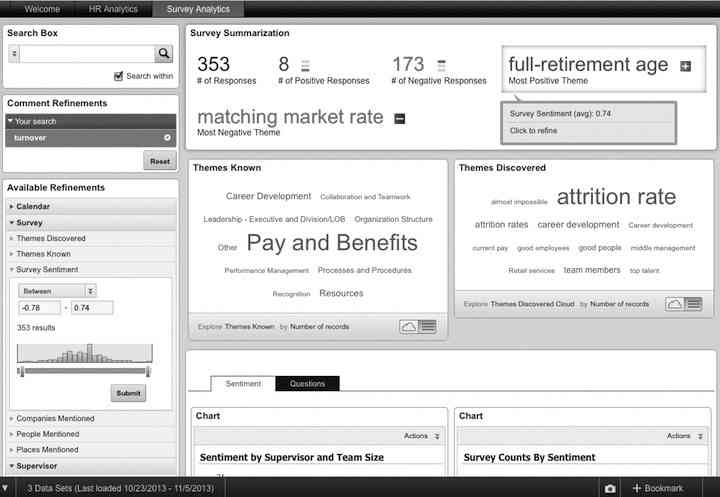
It’s relatively easy to find out “what has happened” or “what is happening” with employee turnover rate. However, it’s much harder to answer the “why” question. For example, why are there high levels of employee self-termination with especially high-performing individuals? What is the root cause for that? Is it because of better opportunity elsewhere, dissatisfaction with managers, or a misaligned level of compensation? A lot of these answers could come from survey data. Companies are able to link survey answers to employee data to explore relationships and hidden causes. An HR manager can search across all these data sources for certain key words such as turnover and start to find correlations between high occurrences of that key word with job functions, departments or lines of businesses, years on the job, years on the current role, date and nature of last promotion, and so on. Text analytics engines are able to generate sentiment scores of the responses based on the occurrence of words and phrases such as dislike, cut in pay, and not satisfied. These sentiment scores from each of the responses can then be combined with other dimensions and facts from the traditional HR data sources to focus on a set of supervisors and other factors associated with high turnover. Such analytical tools can help companies to quickly identify at-risk employees and take appropriate measures to mitigate the risk of losing valuable contributors.
Figure 3 shows an HR analytics application. Users can enter a keyword such as turnover in the search box on the left or explore data through the Guided Navigation panel. The Survey Summary panel on the top right displays summarized metrics, including number of responses, number of positive versus negative responses, and number of supervisors. There are two tag clouds below the Survey Summary panel. The Themes Known section displays what the employees selected from a predefined drop-down list in the survey as the primary theme for their free-form comment, and Themes Discovered contains themes that have been automatically derived from the comments using text enrichment capabilities.

FIGURE 3. HR analytics with survey responses
We have started to notice similar techniques being deployed in expense reporting and compliance auditing through correlating expense items with e-mails based on dates and expense line items.
Customer Churn Prevention
The cost to recruit a new customer is believed to be five times the cost of retaining an existing one. It costs even more to re-acquire defected customers. In fact, a number of independent studies have proven that churn remains one of the biggest destructors of enterprise value for banks and other consumer-intensive companies. Churn has an equal or greater impact on customer lifetime value (LTV) when compared to one of the most used key performance indicators (KPIs) such as average revenue per user (ARPU). This applies to many industries other than consumer banking, including telecommunication, retail loyalty programs, consumer package goods (CPG), and insurance companies.
It’s not surprising that consumer-facing companies have been looking for effective ways to accurately determine the churn analytic guidance of their existing customers. The concept of a 360-degree view of customer is nothing new. Currently, most companies have gone through some level of customer master data management (MDM) effort to obtain a consolidated view of customers across various lines of businesses. Customer master data is acknowledged as critical, but to gain further insight into their customers, other sources of information are now used. New data sources have emerged that allow companies to get a holistic and true 360-degree view of the customer that incorporates activities through all channels and touch points, including call centers, web site browsing history, local office and branch visits, ATM transactions, branch or online surveys, and social media interactions including Twitter and Facebook. A deeper customer profile analysis becomes possible that can provide real-time and actionable insights when and where it’s needed. The customer service representatives can determine the course of action that is most suited to how they are interacting with the customer, whether through phone or online chat.
For example, a telecommunication call center service representative answers a complaint call from an existing customer. The representative can now quickly glance at the customer profile, including churn probability score, projected LTV score, recent activities, and the customer’s social and financial impact. With that holistic information at hand, the customer representative can ease the frustration by avoiding redundant questions and can demonstrate their understanding of the urgency of the situation. For instance, the customer representative could view the stats related to repeated dropped call complaints from the same customer in the past or that this customer is near the end of the current contract. Based on this information, the representative could offer the customer incentives (pre-approved based on business processes) such as a free two-month extension of the contract, a newer-generation cell phone, or a new feature with no cost, all of which are designed to keep the customer from switching to a different carrier. The outcome of these offers can then be loaded back into the system to understand and further improve the effectiveness of each of the offers in customer churn prevention.
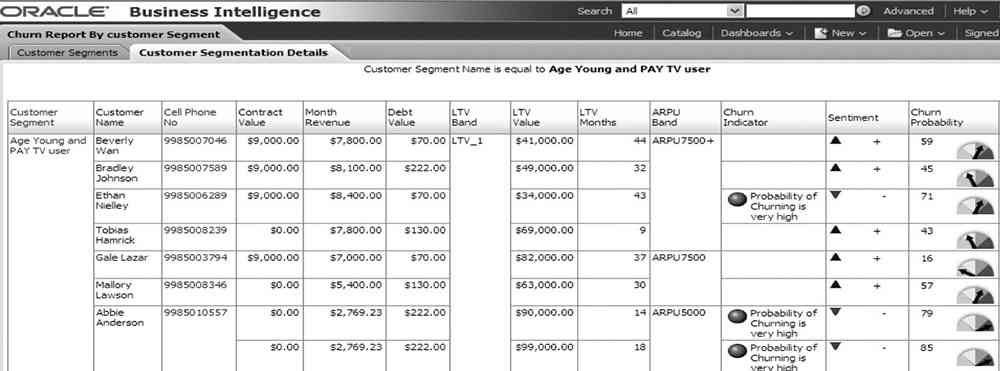
Figure 4 is a sample dashboard that shows the customers by segments, sentiment scores based on their recent social media postings, and their churn probability scores.

FIGURE 4. Customer churn prevention sample application

