 Now that we have wrapped up our discussion on installing Endeca Server, let’s move on to subjects related to Endeca Server management. This article describes common activities for those involved in maintaining Oracle Endeca Server. Endeca Server, like all enterprise systems, requires a level of maintenance, monitoring, and management in order to keep it running smoothly. Planning the day-to-day management of Endeca Server will ensure that your Endeca deployment is productive for your end users. In this section we will cover the following:
- Data domain management
- Backups
- Replication
- Performance monitoring
- Maintenance
Data Domain Management
Data domain management involves creating data domains and data domain profiles. Data domain management is one of the primary means of controlling the behavior of Endeca Server with respect to system resources. Endeca Server administrators use the command-line utility endeca-cmd to perform these actions.
Parameters for data domains are stored in data domain profiles. Data domain profiles are created prior to the creation of a data domain. Let’s take a look at the endeca-cmd example used to create a data domain profile. Shown next is an example of creating a data domain profile named opinion-data:

NOTE
In this example, you can see some of the more important parameters with regard to managing system resources:
- num-compute-threads This sets the number of compute threads available to the Dgraph node, typically equal to the number of CPU cores.
- auto-idle This determines whether the threads for a data domain’s Dgraph processes become inactive after a time period determined by the idle-timeout parameter.
- oversubscribe This allows a data domain to be created even if the system has insufficient resources. When Endeca Server prepares to activate a data domain, it first determines whether there are sufficient resources for this to occur; however, this parameter overrides this check.
- read-only This parameter disallows changes to the data in the data domain. Setting a data domain to read-only increases performance.
After a data domain profile is created, it can be used to create a data domain. The command to create a data domain accepts as a parameter the name of a data domain profile.
For clustered environments, the endeca-cmd utility allows for the management of node profiles, which determine certain aspects of a cluster behavior. There are two parameters for node profiles:
- num-cpu-cores Sets the number of CPU cores available on each Endeca Server node
- ram-size-mb Determines the amount of virtual memory to allocate to Endeca Server
These parameters, especially the ram-size-mb parameter, are of particular interest to Endeca Server administrators because they can be used to increase memory. On a server with a large amount of RAM memory, ram-size-mb allows Endeca to access this memory.
Endeca Server Backups
Backups are a normal and important task performed by server administrators. In this section, we cover backups specific to Endeca Server. The goal of this backup strategy is to preserve data configuration stored in Endeca Server and facilitate the rebuilding of a failed Endeca Server machine in the unlikely event of a complete hardware failure. The server operating system installation should include backup client software to write backups to a backup server. A commonly used backup client is Oracle Secure Backup.
Data Domain Backup
We discussed data domain management configuration in the previous section; now let’s look at another aspect of data domain management: taking backups of data domains. The endeca-cmd utility with the parameter export-dd takes a “snapshot” of a data domain’s index files. The export process occurs asynchronously to the data domain operations, so backups can be run at any time without requiring an outage on the data domain. Only the data domain index data is backed up by this command, and the data domain profile is not captured, nor is any other characteristic of the data domain. The snapshot is stored in the offline directory, specified by the endeca-offline-dir parameter in the EndecaServer.properties file. The following is an example of the command to back up the VoterData data domain:
![]()
This creates a series of directories containing the backed-up indexes:

Using this command as part of the backup strategy, the main directory of the export output in this case is as follows:
![]()
It can be coalesced with the tar command and can be compressed with gzip, as shown here:
![]()
The resulting file is as follows:
![]()
Backing up and restoring the files created with the tar and gzip commands is an effective method for taking backups. The fol lowing is an example of a Linux BASH shell script for backing up domain data. It assumes that the files are ultimately stored in the /backups/Endeca_Indexes directory:
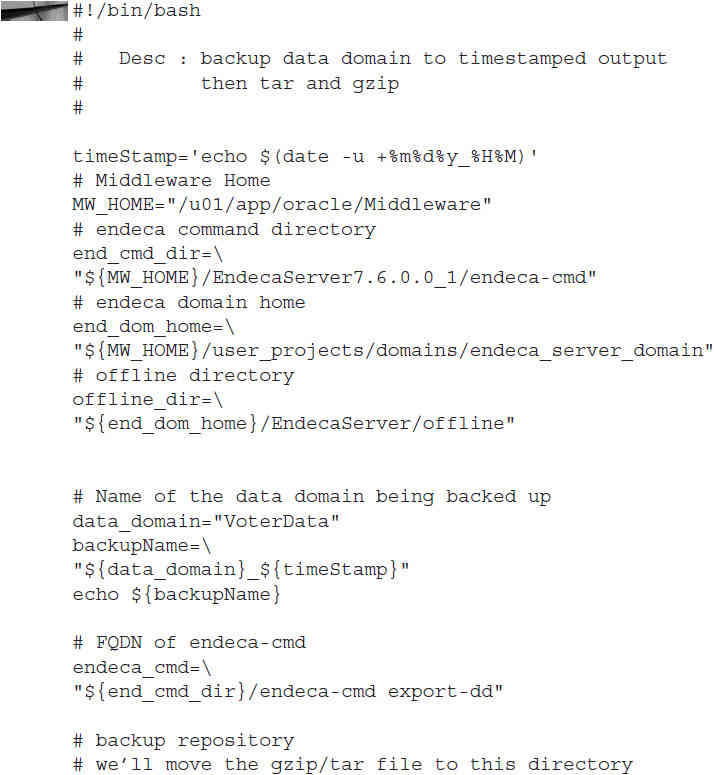
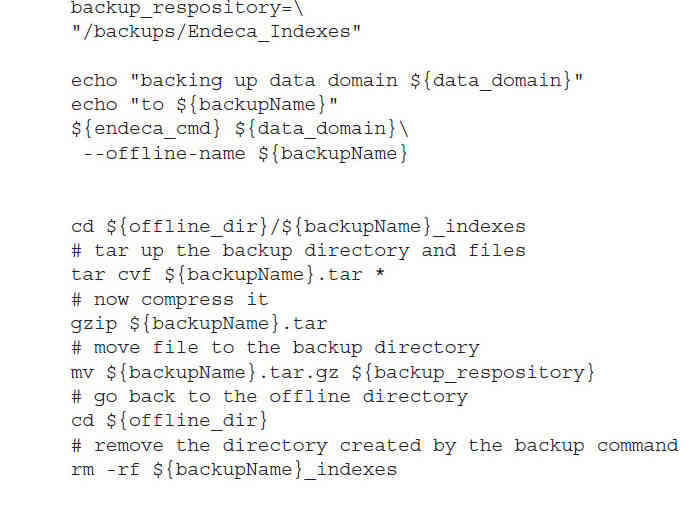
This script can be run several times a day to provide point-in-time recovery that would otherwise not be available for data domain index files. This can be useful in test environments.
Data Domain Profiles
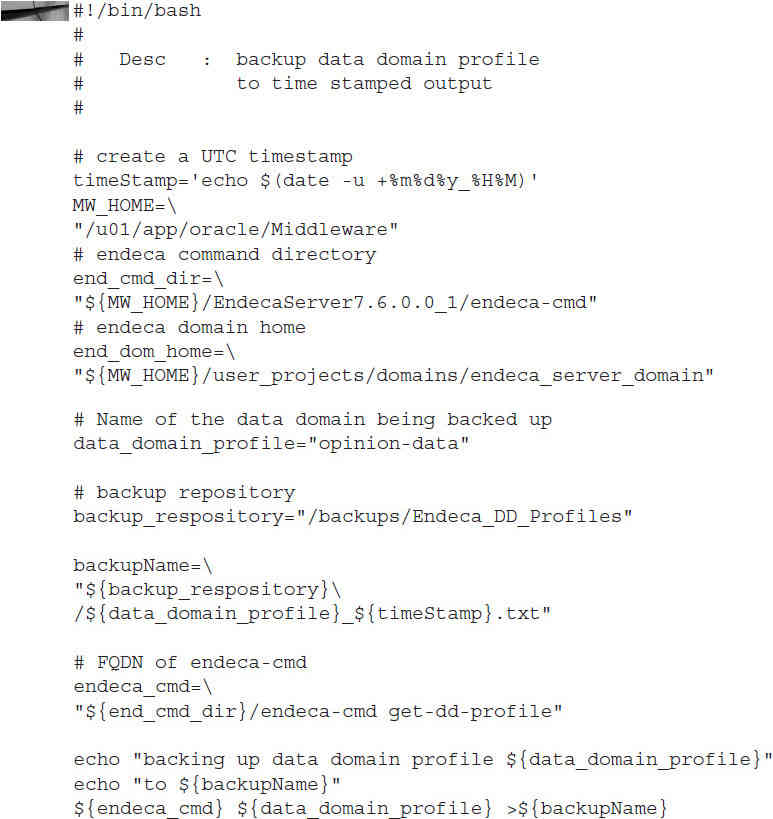
We mentioned that data domain profiles are not backed up with data domain exports. Data domain profiles are not stored on the file system; therefore, they will not be backed up with the file system backups. Data domain profiles contain configuration information important to re-creating a data domain and need to be backed up. The BASH shell script offers a solution to this problem. The script captures the data domain profile settings into a plain-text file. While this file does not allow direct restoration of the data domain profile, the information it contains can facilitate the re-creation of a data domain in minutes. Backups are stored in the /backups/Endeca_DD_Profiles directory.
EndecaServer.properties File
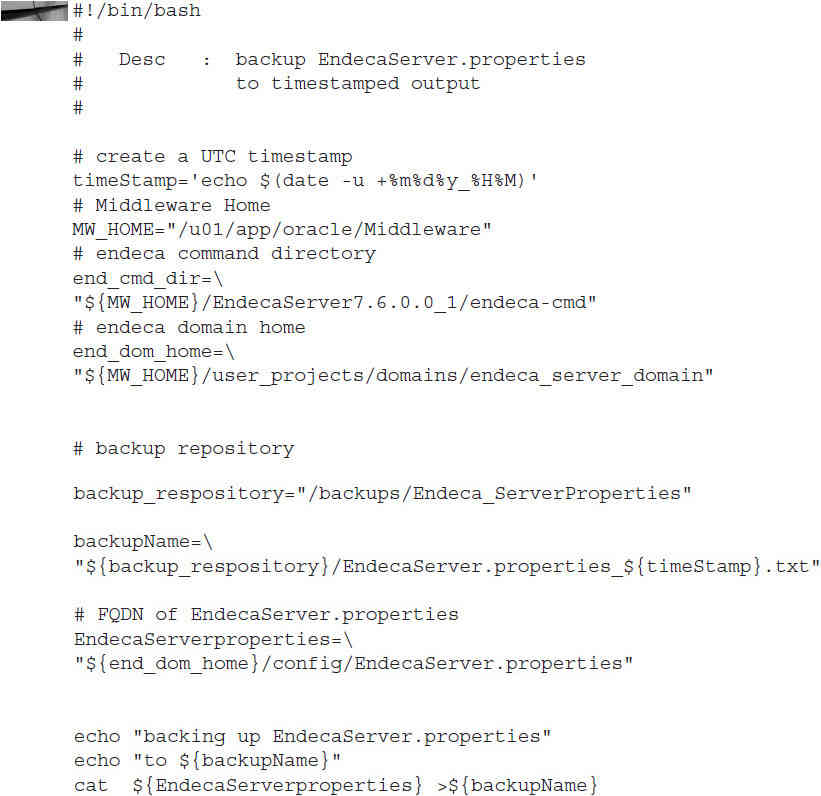
The EndecaServer.properties file is a plain-text file that contains many settings related to the configuration and operational aspects of Endeca Server. We will look at the contents of this file in depth in the next section. (The environment variable $MW_HOME is commonly known as the middleware home and in most installations will be /u01/app/Middleware.) For the purposes of backups, it is important to ensure this file is backed up. Most backup clients will back up entire directory structures, and in the case of Endeca Server, backups of the $MW_HOME should be included in the daily backup schedule. Since we have covered shell scripts to back up data domains and data domain profiles, we would be remiss if we didn’t present a BASH shell script to back up this EndecaServer.properties file. Backups are stored in the /backups/Endeca_ServerProperties directory.
Node Profile Backups
If you have deployed Endeca Server Cluster, one final configuration you should capture is the node profile. The node profile has only two settings, and the backup script for capturing the data domain properties can be modified to capture them. Backups are stored in the /backups/Endeca_ServerNodeProfile directory.
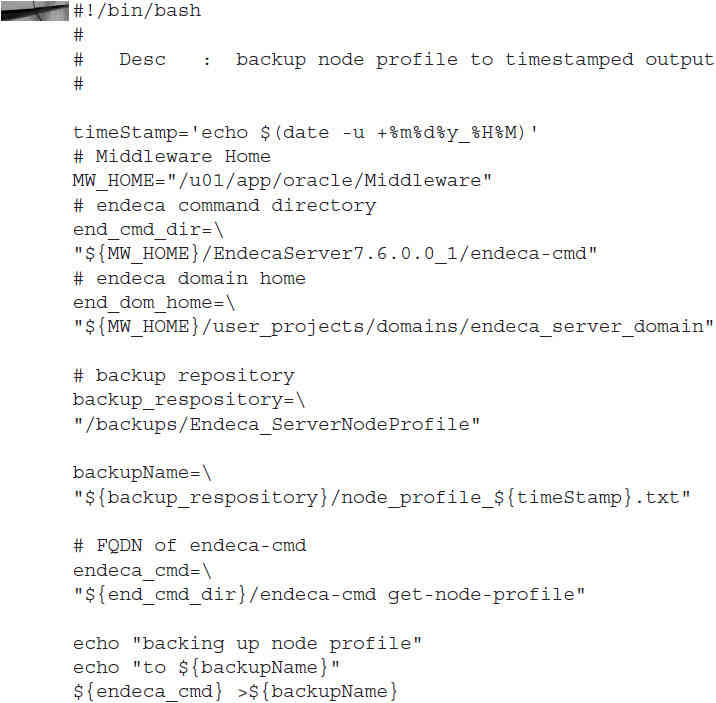
This wraps up the discussion of Endeca Server backups; to summarize, the following should be backed up:
- Data domain indexes with the data domain export command
- Data domain profiles to a plain-text file
- The EndecaServer.properties file
- Node profile settings for clustered environments
Use a scheduling program or facility to schedule backups, and periodically review backups to ensure the efficacy of your backup strategy. The backup directories will fill up over time and should be purged after a set number of days of backups. Here is a simple command to accomplish this:

This command purges the directory used for node profile backups of any backup older than 90 days.
Replication
You may need to replicate a data domain for a variety of reasons, most likely to load a test environment from production. From the command-line interface, there are two methods of replicating a data domain:
- endeca-cmd import-dd imports the files created by endeca-cmd export-dd. This can be used to restore a data domain from a backup or copy a data domain to another server.
- endeca-cmd clone-dd makes a copy of a data domain from an existing data domain. This can be used only on the same server where the existing data domain is located.
As you evaluate your needs for replication, bear in mind that both of these utilities can be used with shell scripts.
Integrator ETL is also used to create data domains and populate them with data and is a third method of replication. When running a graph in Integrator ETL to create a data domain, you replay the steps that were used to create a data domain you want to replicate. However, you are not really copying any data domain from the source to the target with this approach, so this method is not truly replication.
Performance Monitoring
Performance monitoring with Endeca can be carried out with many different utilities. The goal of performance monitoring is to detect excess CPU or memory utilization problems that can cause usability issues with an Endeca deployment. Performance issues can have a variety of causes; most will be caused by excess system usage for the amount of CPU cores or memory available. Issues caused by insufficient CPU cores, memory, or poorly performing storage can be difficult to remedy without curtailing system usage. This chapter began with a section on hardware sizing, emphasized the need to understand workload and to select hardware appropriately, and talked about running Endeca Server on Linux, preferably version 6. Assuming you make good decisions on your choice of hardware to run Endeca Server, the majority of performance problems you will encounter will be related to poorly performing EQL queries or poor production planning, such as running multiple data ingest sessions while users are using Endeca Studio. Once you select a performance monitoring methodology, use it every day to monitor normal operations, and become familiar with the tools you have selected and how a system operating normally appears on the tools. When real performance problems occur, you’ll be adept with the monitoring tools because you are familiar with them and will quickly recognize where the deviation in performance is occurring.
Data Domain Monitoring
Endeca Server includes a monitoring tool that is available from a web browser that provides detailed information about Dgraph processes. The web pages for this tool are titled “Dgraph Server Statistics.” Guidance on using this tool is not provided in the Oracle Endeca Server documentation. Moreover, the documentation states that “the Dgraph Server Statistics page...is intended for use by Oracle Endeca Support only.” Despite this admonition, there is a benefit to perusing the contents of this facility. Much of the data on the Dgraph Server Statistics page is understandable and, when used in conjunction with other monitoring tools, can provide insights into the performance of Endeca Server. The facility is available for each data domain and is accessed via a web browser. You can access the tool via the following URL command:
![]()
Figure 1 shows this facility.
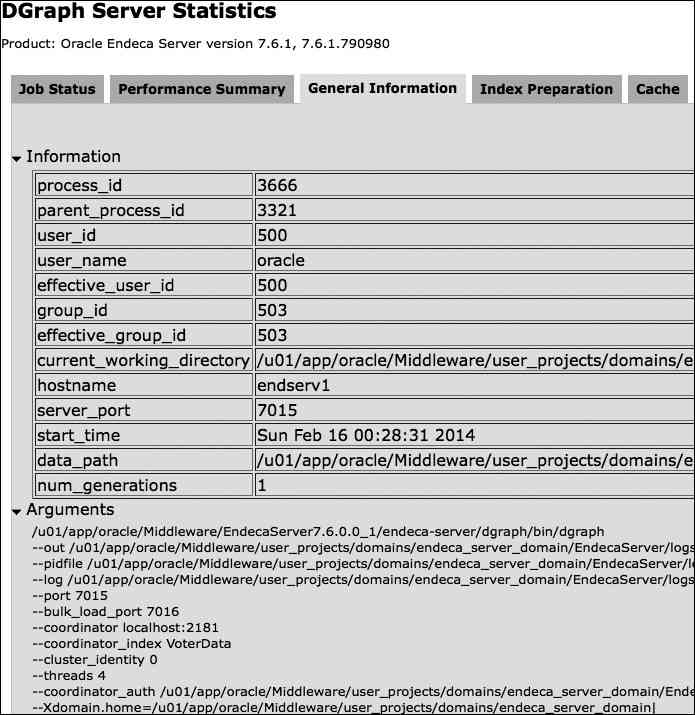
FIGURE 1. Dgraph Server Statistics page
The General Information tab shows information about the Endeca Server installation. The Details tab lists the most expensive queries and “hotspots,” which provide detailed information regarding the performance of individual Endeca Server components. Figure 2 shows the Details tab.
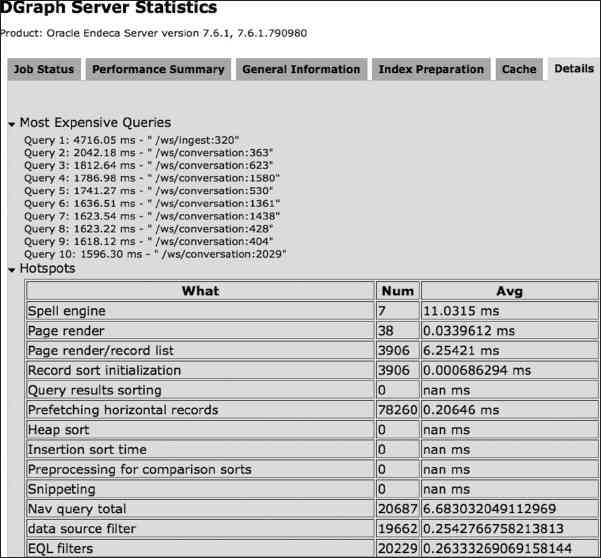
FIGURE 2. Dgraph Server Statistics Details page
The URL command
![]()
resets the data on the Server Statistics page.
Monitoring with WebLogic
WebLogic provides a monitoring dashboard that is customizable and can be accessed from the Monitoring Dashboard link shown in Figure 3 , which appears in the web form immediately visible after logging into the WebLogic console.
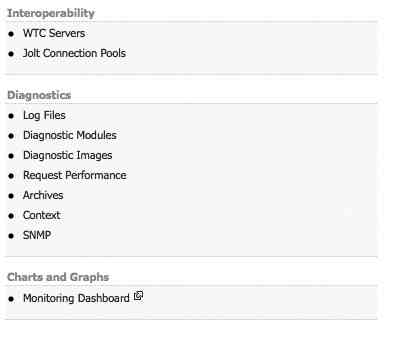
FIGURE 3. Link for monitoring the dashboard
The dashboard has a number of prebuilt views, but its real power is the capability to create custom dashboards. Figure 4 shows the dashboard with two metrics displayed.
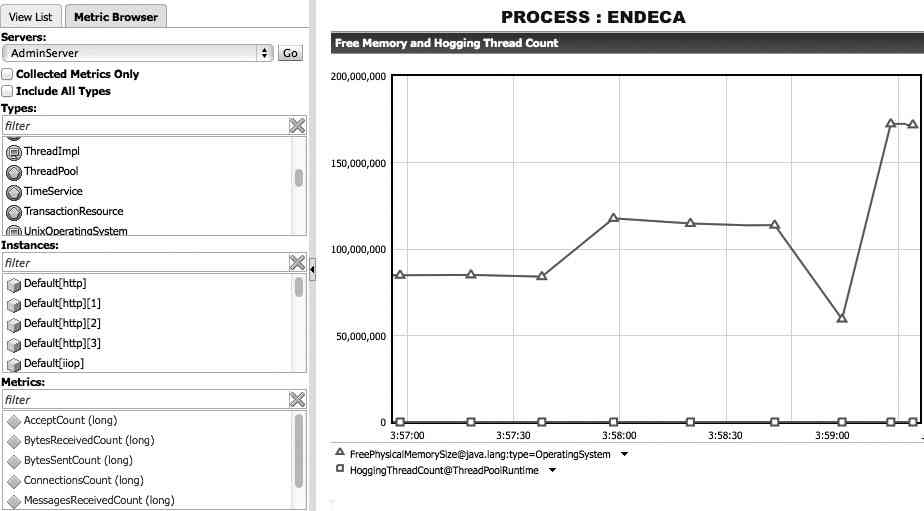
FIGURE 4. WebLogic monitoring dashboard
Using the Types selector, you can find many aspects of the server to monitor, including UNIX/Linux metrics and thread metrics. Once you find a metric you want to monitor, drag it onto the chart. Different chart types are available, including radial gauges and bar charts. Many charts can be displayed on one screen. Note that the WebLogic monitoring dashboard displays real-time data and cannot recall historic data.
OS-Level Monitoring
Endeca Server administrators and systems administrators must collaborate regularly on supporting Endeca Server and troubleshooting performance issues. Systems administrators often use command-line utilities to quickly determine performance characteristics of processes on a Linux server. One of the best tools to use for an overall view is Linux top, which lists the top resource-consuming processes on a server. Figure 5 shows top for Dgraph processes, and a quick inspection reveals process ID 7163 is consuming more memory and CPU resources than other Dgraph processes.

FIGURE 5. Linux top for Dgraph processes
Another useful utility for monitoring CPU activity is uptime. An example of uptime output is shown here:
![]()
The last three columns of uptime are useful for quickly assessing overall server performance and indicate the 1-, 5-, and 15-minute system load average. Load average indicates how long threads of execution must wait before executing. Values greater than 4.0 indicate a performance issue with regard to CPU resources; values greater than 10.0 indicate extreme system loading.
The Linux command vmstat indicates the extent of memory paging. Because of the importance of memory to Endeca Server performance, it is wise to use this command to monitor paging. Figure 6 shows vmstat.

FIGURE 6. Linux vmstat screen capture
With vmstat, pay particular attention to the so column. Nonzero numbers in this column indicate that swapping is occurring. Once you observe swapping, you can use top and the Linux command ps to determine which process is having issues.
Eneperf
eneperf is a load-testing tool that ships with Endeca Server; it can be used to replay log files from sessions and can also be used for load testing. Some Endeca admins have used it to debug issues with past sessions by replaying request logs. eneperf is a command-line tool, and running the command from the command line without parameters displays a long list of user instructions. For the sake of brevity, these instructions will not be listed here. The most basic use of eneperf is as follows:

Oracle Enterprise Manager 12c
Oracle Enterprise Manager provides the ability to monitor an Endeca installation, and when monitoring Endeca Server, it provides a single interface for monitoring WebLogic, Endeca Server, the Linux operating system, and storage. If the ZFS appliance is used for storage for Endeca Server, Oracle Enterprise Manager 12c and Ops Center can manage the ZFS appliance. Plug-ins are available to monitor the Tomcat application server and Microsoft Windows Server, should you choose to use these in your Endeca deployment. Figure 7 shows an example of a pie chart depicting the uptime status of all systems monitored by Enterprise Manager 12c.
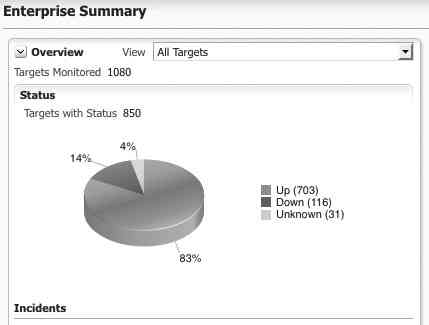
FIGURE 7. Enterprise Manager 12c monitored targets summary
Figure 8 shows an example of the disk monitoring that is available from Enterprise Manager 12c.

FIGURE 8. Enterprise Manager disk I/O monitor
Enterprise Manager does not merely provide dashboards, but collects historic metrics that can be examined for the last 30 days. Custom dashboards and reports can be created, and because of the historic metric retention, prior performance data can be viewed. Earlier in this chapter, an example Linux shell script for backing up a data domain index was shown. Enterprise Manager 12c also features a scheduling facility that could be used to schedule this type of shell script for automating the maintenance for Endeca Server. Figure 9 shows the scheduling facility of Enterprise Manager 12c.
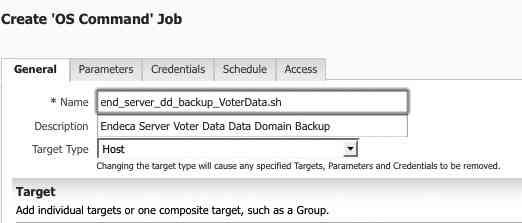
FIGURE 9. Enterprise Manager 12c scheduling facility
Enterprise Manager 12c must be installed on a separate server dedicated to hosting Enterprise Manager and requires a database to host a repository database. Enterprise Manager 12c can monitor most enterprise platforms, including database servers, application servers, and most operating systems. Enterprise Manager 12c can monitor not only your Endeca deployment, but many other aspects of your enterprise applications and can greatly enhance your ability to monitor and control your enterprise infrastructure.
Maintenance of Oracle Endeca Server
Endeca Server is based on Java, and the stability and security of the Java Development Kit (JDK) installed on the server is an important part of server maintenance. Oracle recommends staying current with Java updates on Endeca Server. To install a Java update, Endeca Server must be stopped, so outages need to be planned and coordinated whenever a Java update needs to be installed. You should test any Java update on a test server for at least two weeks before installing it in production to ensure it does not cause issues with your installation of Endeca Server.
Maintaining Endeca Server also requires that logs be monitored and rotated. Endeca Server uses the following directory for logs and other diagnostic files for Dgraph:
![]()
The types of files in this directory are as follows:
- .pid This stores the process ID of each Dgraph process. This file is always one line only.
- .out This is the stdout/stderr log for the Dgraph process, including startup/shutdown and ingest processes. It’s useful for debugging problems.
- .reqlog This records incoming requests to the Dgraph process from web services.
![]()
rolls the request log files and archives the current request log file. As request logs are rolled, they have the following extension:
![]()
The following directory listing shows rolled request logs:

In this example, the process PID is 3666. This URL can be called using the Linux curl command and easily automated with shell scripts for this maintenance task. Figure 10 shows the output from this command being executed on the local Endeca Server.

FIGURE 10. Linux curl command used for log roll
Increasing verbosity can be useful in understanding the cause of problems.
This command can be used to enable logging for a domain and sets verbose logging for requests:
![]()
The WebLogic server used in conjunction with Endeca Server also has logs that can be useful, located in the following directory:
![]()
The WebLogic server rotates the logs in this directory automatically, except AdminServer.log. There are three logs in this directory:
- AdminServer-diagnostic.log This contains messages from WebLogic applications.
<endeca-server-domain>.logThis is used to monitor the status of the domain.- AdminServer.log This is the only log file in this directory containing information useful in debugging Endeca Server and can be useful for run time and stability issues.
All of these logs can also be viewed within the WebLogic web-based administrative interface.

