 You can create planning, budgeting, forecasting, and profitability and cost management systems using Oracle Essbase features embedded within custom Microsoft Excel or web applications. Custom applications come with challenges, including template creation (often by budget administrators), ease of use, end-user support, documentation, custom programming, a path for upgrades, and ongoing maintenance. For example, on one job, we had a situation where one employee created and owned the Excel-based planning models. The system was not documented, and it contained a lot of Visual Basic code leveraging the Essbase APIs. No one else in the organization had the knowledge necessary to maintain the application, and because the application was created by the finance department, it was not supported by the IT organization. Therefore, while this custom application did the job in the short term, the risks to the organization were high over the longer term.
Start-from-scratch solutions are obviously not for everyone. Fortunately, other options are available. As a result of the high demand for packaged applications, Oracle assembled the Oracle Enterprise Performance Management System. Two applications within that Oracle system leverage Essbase as their database and calculation engine: Planning and Profitability and Cost Management. Planning focuses on planning, budgeting, and forecasting. Profitability and Cost Management helps you to determine profitability and manage costs. With these Essbase-based applications, you gain all the advantages of a packaged application, without sacrificing the speed and power of an OLAP system.
In this section, we review the features and functionality of the Planning application and the Profitability and Cost Management application. We then look at the administration component called Oracle Hyperion Enterprise Performance Management Architect, which an administrator can use to create, manage, and deploy Planning and Profitability and Cost Management applications, as well as Essbase cubes. We end with a brief look at the architecture for all three applications.
Oracle Hyperion Planning
Oracle Hyperion Planning is a centralized, OLAP-based application for planning, budgeting, and forecasting. Essbase is the underlying calculation engine and data repository.
Planning offers data-entry forms, custom context menus for ease of navigation, a graphical interface for creating rules and calculations, and built-in workflows. The workflow component helps drive collaboration throughout the planning, budgeting, and forecasting processes. For example, in the budget process, budget owners can submit their budgets for approval with commentary, and approvers can respond in a variety of ways, including sending comments back to the owner.
To satisfy the diverse needs of user communities within an organization, Planning provides a web-based interface and an Excel-based interface. A centralized server provides a single point of administration for both interfaces. For example, an administrator can create one data-entry template that is available from either a web browser or Excel.
Planning includes the following features:
- Support for top-down and bottom-up planning Senior management can set high-level targets at upper levels and allocate the targets down to lower levels (top-down). Planners can also start building budgets from the lowest level (bottom-up) and have comparisons to the targets.
- Multiple versions for iterative planning cycles Planners can set up multiple versions of the plan to create what-if scenarios. They can also capture plan iterations and create comparisons between the iterations.
- Support for driver-based plans Planners can set up assumptions for drivers that may affect their financial plan, such as market share, inflation factors, interest rates, midpoint salaries, and FICA limits.
- Graphical Calculation Manager Planners can create easy and complex business rules and allocations without having to write script.
- Web-based and Excel-based data-entry forms and annotations Planners can create data forms to collect key plan information. A single data form definition is valid for both interfaces.
- Process management of the planning cycle Planners have a hierarchical or matrix review and sign-off with collaboration.
- Integration with other systems Planning ships with Oracle Data Integrator Enterprise Edition (ODI). ODI can be used to load metadata (such as charts of accounts, departments, and products) and related data from a relational data source.
- Currency conversion for multicurrency applications Currency conversion is built into Planning.
- Workforce Planning module This module provides predefined and supported content for the planning, budgeting, and forecasting of headcount and salary expenses.
- Capital Expense Planning module This module provides predefined and supported content for the planning, budgeting, and forecasting of capital expenditures and related profit and loss, balance sheet, and cash flow statements.
- Common administration Planning ships with Performance Management Architect, which is a common tool for managing shared hierarchies and creating applications for Planning and Profitability and Cost Management.
In a packaged solution, administrators expect the supporting components of the system to adapt to changes made to the system. For example, if an administrator adds a new cost center to an application, then the business rules, data-entry forms, custom navigation menus, process management, and related reports should automatically become aware that the new cost center exists. The administrator should not need to make any manual changes. Planning makes use of Essbase features to meet the demand for adaptive software. For example, when designing a business rule or data-entry form, the user will use family-related functions like IDescendants (Total Company). With family-related functions, the business rule and data form can adapt automatically to the addition of a new cost center. The following sections describe the adaptive components of Planning: Calculation Manager, data-entry forms, custom menus, process management, and task lists.
Calculation Manager
Business rules and the related calculations are the backbone of a planning application. Oracle developed a common interface, called Calculation Manager, where users can design, validate, and administer business rules in a graphical environment. Calculation Manager leverages the power of the Essbase calculation engine without the need to write Essbase calculation scripts. For example, you can graphically create a rule to aggregate the IT departmental expenses and allocate the total to all other cost centers (excluding the IT department) based on the number of PCs they have in place.
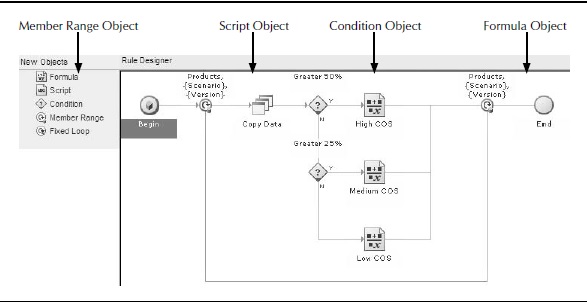
Figure 1. Business rule flowchart
Calculation Manager has four main components: business rules, templates, variables and run-time prompts, and rule sets.
Business Rules A business rule consists of components that are dragged and dropped into a rule flowchart. Figure 1 shows a sample flowchart and points out the components of a business rule.
As summarized in the New Objects area of Figure 1, a rule has five possible components:
- Formula This is the primary component of a business rule. Formulas contain calculation statements that assign values to accounts. For example, operating cost of sales (COS) can be assigned the value of 50 percent of operating revenue (Operating COS = Operating Revenue / 2). You can embed Essbase functions within formulas. Figure 2 shows two sample formulas within the Formula component.

Figure 2. Formula component of a business rule

Figure 3. Script component of a business rule
- Script With the Script component, those who are familiar with Essbase Script can add calculation statements to their rules using Essbase syntax instead of formulas. You can embed Essbase functions within scripts.Figure 3 shows the calculations from Figure 2 recast in Essbase Script.
- Condition You insert other rule components within the scope of the Condition component. A condition is an if-then statement. When the if part of the statement is true, Calculation Manager executes the statements within the Condition component. When it is false, the statements of the Condition component are skipped. You can specify conditions based on metadata or on the data itself. You can use Condition components to test which calculation should be executed. For example, the condition shown in Figure 4 states that if gross margin percent (Gross Profit / Net Revenue) is greater than 25 percent, execute the rule for medium COS.
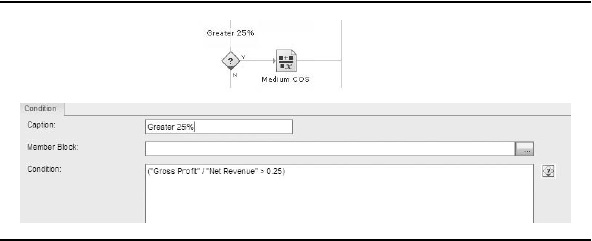
Figure 4. Condition component of a business rule
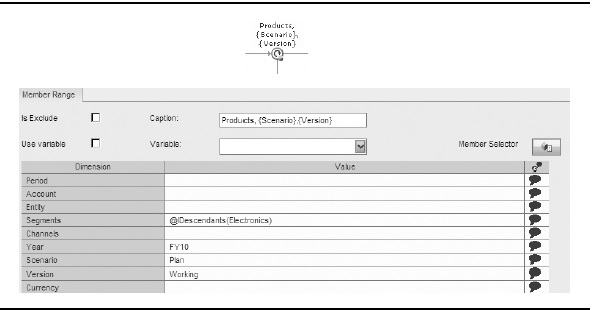
Figure 5. Member Range component of a business rule
- Member Range This component creates a focus on a member or members where you would like the calculation to execute. For example, the range
- in Figure 5 specifies that this portion of the calculation will execute for all products under the Electronic category for the year FY10 for the Plan scenario and the Working version.
- Fixed Loop This component indicates that a block of code is to repeat for a specified number of iterations. For example, you could specify that a loop execute the components within its scope ten times.
Templates The rule designer provides predefined business rules called templates. Templates can be used for clearing a portion of the database, copying a portion of the database, creating allocations, and aggregating a portion of the database. A Units/Rate/Amount template solves for any of the three variables, as long as two of the three variables are defined. Figure 6 shows a template specifying a revenue calculation based on units and price. Using this template, if a planner enters values for units and price, the template solves for operating revenue. If another planner enters values for price and operating revenue, the template will solve for the number of units.
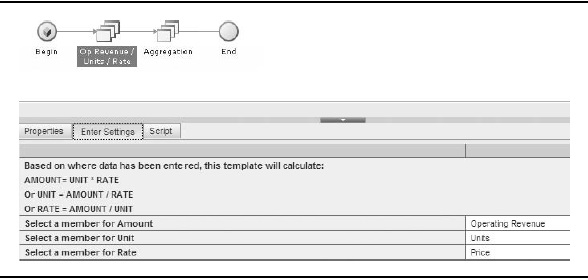
FIGURE 6. Template rule designer
Variables and Run-Time Prompts Variables are user-defined values that are set at the global, application, rule, or Essbase level. For example, you can create a variable called CURRYEAR and set it to 2009. Rules containing this variable will use the year 2009 in all calculations. In subsequent years, you can reset CURRYEAR to the new current year, and all rules that contain the variable automatically use the new value. Using variables eliminates the need to update each rule manually when the value of a global variable changes.
Run-time prompts (RTPs) can be used to ask the user to enter required information during the execution of a calculation. For example, if you had a business rule to increase an account by a given percentage, the RTP would ask the user to enter the percentage value.
An advanced feature of RTPs uses members that are on the data-entry form. The form enters the tokens into the business rule, and executes when the form is saved without prompting the user. For example, consider a data-entry form where the point of view reflects these settings: Scenario=Plan, Year=2009, Version=Working, and Entity=Dallas. If the end user changes the point of view to show Houston instead of Dallas and saves the change, the rule is updated to specify Houston.
Rule Sets Rule sets contain two or more rules that are calculated simultaneously or sequentially. For example, if you are allocating the IT department's expenses to all other cost centers, you first want to aggregate the expenses, and then run a series of allocations. You can create a rule set to automate the calculation and allocations.
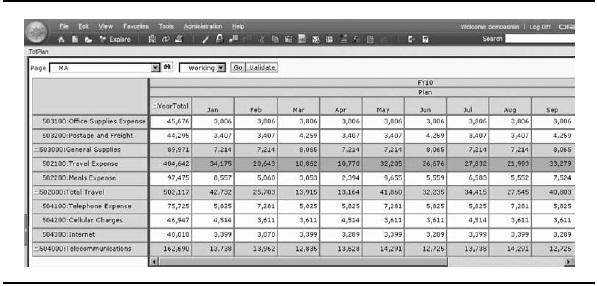
Figure 7. Data-entry form in a web browser
Data-Entry Forms
Data-entry forms are spreadsheet-like grids with rows and columns for entering and modeling data. Figure 7 shows a sample Planning data-entry form displayed in a web browser.
Figure 8 shows the same data-entry form displayed in Microsoft Excel. In Excel, a companion line graph aids understanding of the relative differences among expenses.
Creating Forms You design data-entry forms in a wizard by selecting the columns, rows, and page headers. Data-entry forms are designed using family- related functions (like IDescendants) and variables (like CURRYEAR) to minimize the number of forms required, and for monthly and annual maintenance during the monthly forecasting and annual planning processes. For example, if you set the variable CURRYEAR to FY10 for this year, all annual planning data-entry forms for the current annual operating plan will reference the year FY10. Next year, you can set the CURRYEAR variable to FY11, and these same forms will now reference FY11 as the current planning year. This use of variables and functions minimizes the amount of maintenance required for the system. Figure 9 shows an example of the column and row options for a data-entry form.
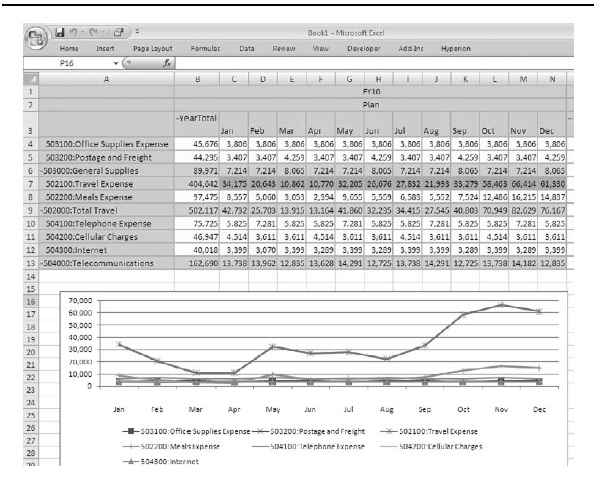
FIGURE 8. Data-entry form in Microsoft Excel with line graph below
Using Forms Planning includes various out-of-the-box data-entry features for entering and modeling data. End users can do the following with the data in a form:
- Enter data You can enter data directly into cells on a data-entry form. There are visual clues when data changes. When a cell has changed, the data-entry form marks the cell by changing the background of the cell to a darker yellow. After the data is committed to the application, the cell reverts to the original color. Figure 10 shows two data cells with changed values.
- Spread data changes You can spread data from summary to base time periods automatically. For example, in Figure 11 a planner changes the year total of Office Supplies from 45,000 to 50,000. The difference is spread down to the month proportionately based on the values that were previously there.
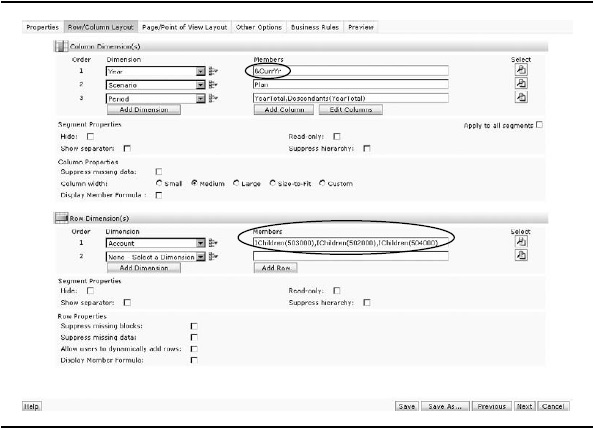
Figure 9. Data-entry form wizard
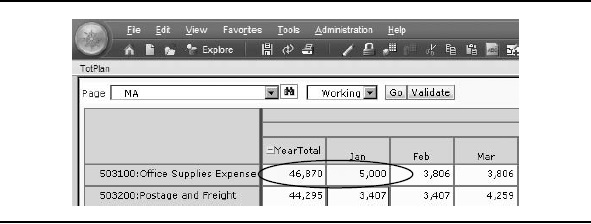
Figure 10. Data cells with changed values are indicated with a yellow fill.
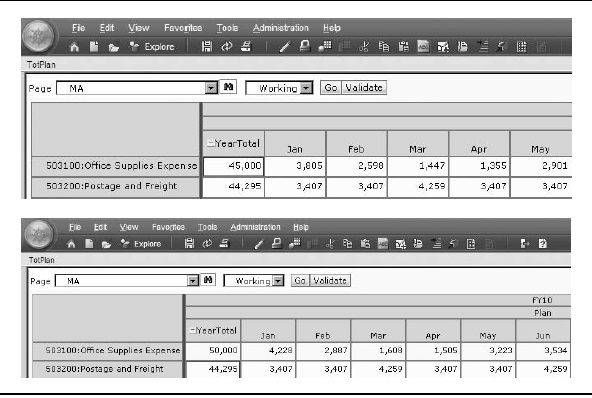
Figure 11. A change to a total value is reflected proportionally across its members.
- Increase and decrease values for members You can use the Adjust Data tool to increase or decrease data by a value or percentage. In Figure 12, a planner specifies a 5 percent decrease to Office Supplies Expenses.
- Increase and decrease values for dimensions You also have the ability to adjust data for dimensions. A planner can adjust the data by various spread

Figure 12. Data for a member can be adjusted by user-defined values.
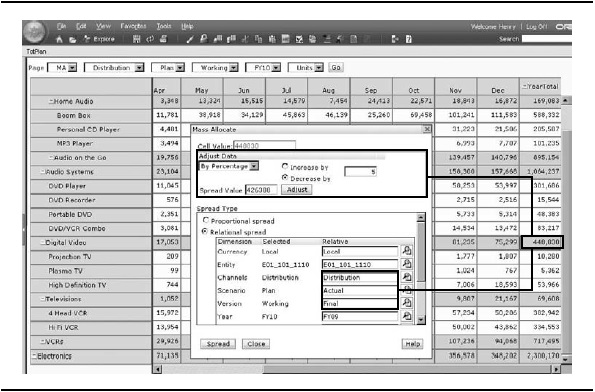
Figure 13. Data for a dimension can be adjusted and spread according to userdefined values.
methods, such as proportional spreads based on prior year actual values. In Figure 13, a planner decreases overall sales units by 5 percent for the DVD product line. She specifies a relational spread for the FY10 Working Plan based on the proportional values found in the Final version of the Actual scenario for FY09.
- Execute predefined calculations You can execute business rules to perform predefined calculations on data. For example, planners can enter key revenue drivers, and when the data is saved, execute a business rule to derive revenue and cost of sales based on the driver inputs. Figure 14 shows the drivers (Units through Sales Allowance %) followed by the business rule calculated accounts (Operating Revenue to Gross Profit).
- Add comments and dates You can add text comments directly into a data form. For example, a planner may need to enter a description or justification for the addition of a capital expenditure. You can also add dates directly into a data form, such as when a capital item was acquired for the purposes of depreciation. In Figure 15, a planner has added comments about a company car, its purchase date, and the date that it went into service. He likely has (or will create) a business rule to depreciate the value of the car automatically based on the In Service date.
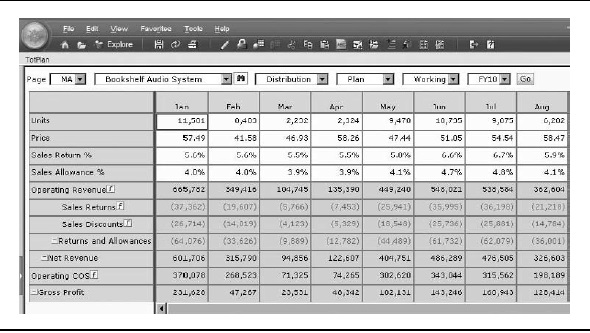
Figure 14. Drivers and calculated accounts in a business form.
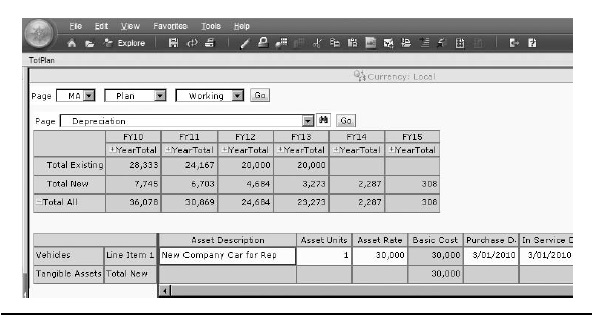
Figure 15. Comments and important dates can be added to data.
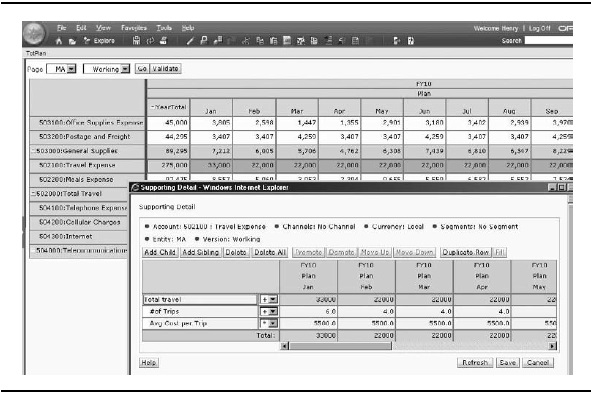
Figure 16. Planners can add detail to line items.
- Add detail to line items You have the ability to add line-item detail for base accounts. For example, your application may have an account for Travel Expense, but the planner wants to enter each trip. By using the line- item detail feature, the planner can build up the detail to derive the total Travel amount. In Figure 16, a planner has decided to record the number of trips and the average cost per trip.
- Attach documents You can attach documents directly into a data form. For example, a planner may want to attach a copy of the funding document in PDF format for justification of the new capital expenditure, as shown in Figure 17.
You can make data-entry forms more dynamic by adding context menus, as discussed in the next section.
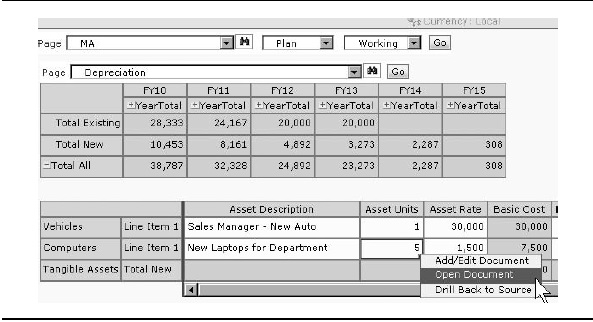
Figure 17. Attach a document in a data form when detail is required.
Custom Menus
While in a data-entry form, you can right-click a row or column to display a context menu with related actions. For example, after entering data, you may want to use the context menu to move to the Manage Process page, where you can approve a predefined scenario and version for use. Administrators are responsible for creating context menus and associating them with data-entry forms.
Here is a list of the types of tasks you may want added to the context menus:
- Launch another application, URL, or business rule, with or without runtime prompts
- Move to another data form
- Move directly to the Manage Process page, with a predefined scenario and version
For example, in Figure 18, a right-click on the TBH1 row displays a context menu with related hiring actions, such as the option to add or remove a to-be-hired employee.
The context of the right-click is relayed to the next action. Any content that exists in the Page drop-down list (for example, the selected cost center) is passed to the next action, and the end user does not need to reenter that information. Figure 19 shows a sample form with inherited content.
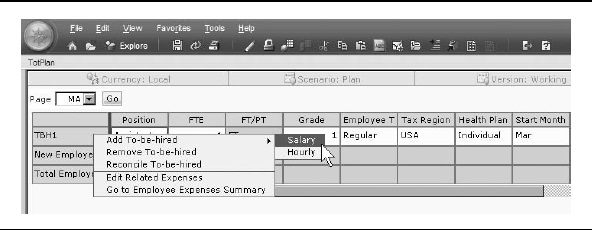
Figure 18. Administrators create context menus and associate them with forms.
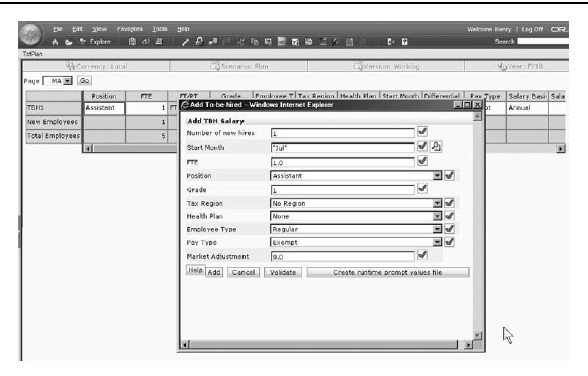
Figure 19. Content is inherited from the page where the context menu action was initiated.
Process Management
Process management enables you track the progress of your budget, view status information, identify ownership, and change the budget status at any level within the organization. Process management reduces budget cycle time through these key characteristics:
- Approval process Preparers submit plans for approval and reviewers approve or decline submitted plans.
- Audit trail Includes built-in audit information through annotations and process status. For example, preparers and reviews collaborate by including comments, and the system maintains an audit trail of the status of the plan.
- E-mail notification E-mail notifications are sent when a status changes. For example, when a plan preparer submits a budget for approval, the reviewer receives an e-mail message stating that the plan is ready for review.
Task Lists
Task lists are a method of guiding users though the planning process. They provide a list of specific activities to complete within and outside the Oracle Enterprise Performance Management System. When an organization's plan or forecast requires end users to perform multiple activities, some of which may be performed infrequently, task lists provide guidance in completing these activities. For example, Figure 20 shows a task list that includes five tasks: allocating top-down strategic targets, compiling and reviewing the revenue plan, preparing and reviewing financial statements, and submitting the plan for approval.
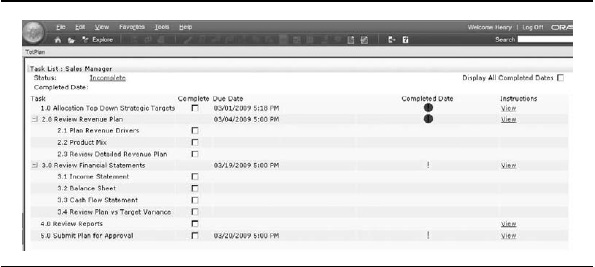
Figure 20. Sample task list
Oracle Hyperion Profitability and Cost Management
Profitability and Cost Management is a packaged application that manages the cost and revenue allocations required to compute profitability for a business segment, such as a product, service, customer, region, or branch. The application provides a process that allows a business user to define allocation rules in business terms. The application translates these rules into underlying calculation scripts. By having a packaged application to create allocation definitions in business terms, business users are able to quickly create, deploy and maintain profitability and cost management solutions.
Before Profitability and Cost Management, it was common for business users to create complex Excel modules that linked a bunch of spreadsheets, and were difficult for other business users to decipher. Business users with access to Essbase would extend these Excel models by using the calculation functions within Essbase, but this usually required the assistance of an Essbase administrator to help write the complex calculations scripts required. While the combined Essbase/Excel solution was an improvement over Excel on its own, it did not provide business users with the flexibility to easily revise the allocation definitions to reflect changes in the business operations. Neither custom solution provided a user-friendly interface to define the profitability module or traceability of what was allocated and how it was allocated. Having a packaged solution for these tasks offers many benefits.
Building a Profitability and Cost Management Model
Profitability and Cost Management applications are referred to as models. A model represents part or all of an organization, and starts with costs and revenue values, often in a form similar to the organization's chart of accounts. These initial financial values are transformed through one or more allocations to assign reasonable and defensible cost values to ultimate cost (or profitability) objects—products, services, customers, and so on.
Building a Profitability and Cost Management model follows these steps:
- Define stages Define the number of cost or revenue transformations within an allocation process.
- Create drivers Define the methods used to calculate how source values are allocated to their destinations within a stage.
- Select drivers Choose which driver methods will be used by which source costs or revenues.
- Make assignments Map source cost and revenues to destinations.
- Collect data Use any number of existing utilities to load cost, revenue and driver data into the application's database (Essbase) or manually enter data through the Profitability and Cost Management data-entry forms.
The following sections detail each of these steps.
Defining Stages Stages represent the network of allocations within your organization. They enable you to create allocations that require multiple steps by defining a calculation sequence. The allocation result calculated and stored in a prior stage becomes the source value to be allocated in the following stages. You can define up to nine stages in your model. For example, total labor costs for the department collected in stage 1 are allocated to the activities performed by each department in stage 2. The total for each activity, in turn, can act as a source value to be allocated in a subsequent stage. Stages can be skipped when certain costs do need to reflect that stage's specific transformation. For example, raw material costs collected in stage 1 can be allocated directly to the products in stage 3. Figure 21 shows five stages.
The overall process for transforming costs from stage to stage is that source costs from one stage will be assigned to destination costs in subsequent stages, using a mathematical method (a driver). The resulting model is a series of "source to destination using a driver" relationships. After the stages are defined, the business user will define the required drivers, identify which sources will use which drivers, and define the source-to-destination assignments.
Defining and Selecting Drivers Drivers provide formulas for allocating the source intersections values to the destination intersections. For example, the wages for the manufacturing department could be split among the different activities based on the number of hours consumed by each activity. Profitability and Cost Management.
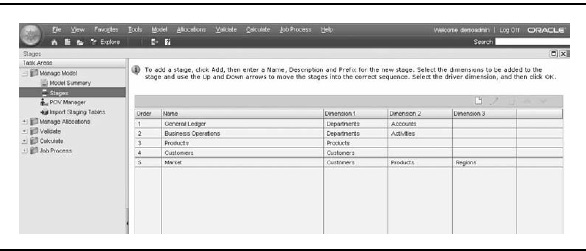
Figure 21. Defining stages
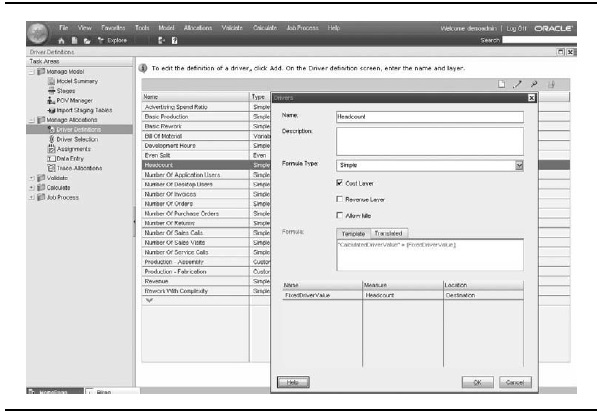
Figure 22. Defining drivers
enables you to create an unlimited number of drivers. When you create a driver, you can select from predefined formulas, such as even split, or you can create custom formulas. In Figure 22, drivers have been created for even split, headcount, number of application users, and so on.
After drivers have been defined, the business users assign the drivers to applicable source members for each stage. For example, in Figure 23, the activity of invoicing by the finance department is to be assigned based on the number of invoices created.
Making Assignments Assignments represent the links between data in stages. For each intersection of dimension members within a stage that contains source data, you assign downstream destinations. The destinations can be within the same stage as the source intersections. This assignment is called an intrastage assignment. Intrastage assignments can be reciprocal. For example, the HR department could have the IT department as an assignment, and the IT department could have HR as an assignment. Dimension intersections in later stages cannot have assignments in earlier stages. Figure 24 shows an assignment example that shows that corporate rent will be distributed to 45 department-activities based on a square footage driver.
After all assignments are made, it is time to collect data.
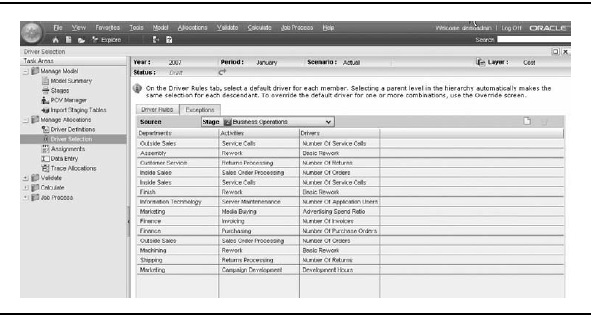
Figure 23. Selecting drivers.
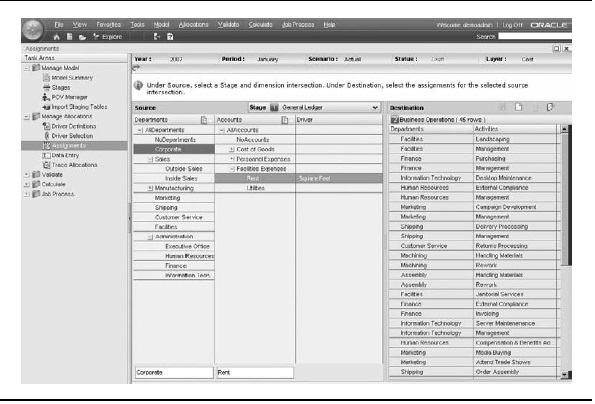
Figure 24. Making assignments.
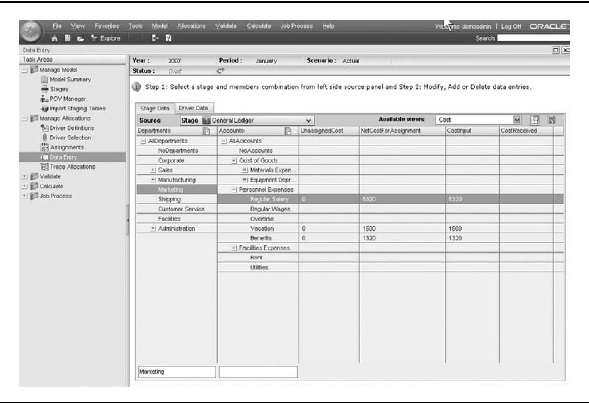
Figure 25. Manually collecting data
Collecting Data You can import cost, revenue, and driver data into the underlying Essbase database by using Essbase load rules, Smart View, or ODI. After loading data into your model, you use the Data Entry window to verify the data, as shown in Figure 25. You can edit data or add missing data in this window, if necessary. The Data Entry window has separate tabs for Stage Data and Driver Data. On the Stage Data tab, you can view cost, revenue, or driver data for a selected stage and selected measures. You can save your measure selections as a view that you can reuse.
After all data has been collected, you can validate the model.
Validating Model
The model is verified against model validation rules to ensure the structure is sound before adding data. The structure validation checks to help ensure these criteria are correct:
- You assigned a driver to each dimension intersection that is assigned destination members.
- You assigned destination members to all dimension intersections to which a driver is assigned.
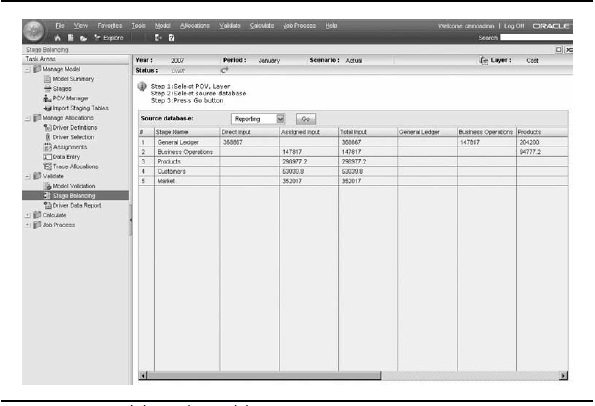
Figure 26. Validating the model
- Intrastage assignments are correct.
- Reciprocal assignments are correctly defined.
After the model is calculated, you can use built-in features to help validate the correctness of these calculations. Figure 26 shows the Stage Balancing report, which illustrates the high-level flow of costs across the stages. It will provide the user with a quick recap of the flow of costs and highlight where the allocations may need further work.
Tracing Allocations
A trace allocation report, such as the one shown in Figure 27, provides a graphical representation that enables you to trace allocations throughout the model. For a selected member intersection in a stage, the report lets you move backward or forward through the model. You can move backward from the intersection to view the source members that contributed to the value for the intersection and the amount that each contributed. You can move forward to view the destination members to which the value for the intersection was allocated and how much was allocated to each member.
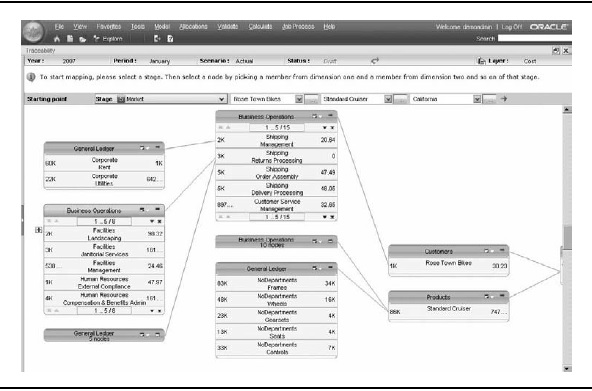
Figure 27. Tracing an allocation
Oracle Hyperion Enterprise Performance Management Architect
Performance Management Architect offers a centralized interface where administrators can manage, create, and deploy Oracle Hyperion applications. Eligible products include applications for the Fusion Editions of Planning, Profitability and Cost Management, as well as Oracle Hyperion Financial Management and custom Essbase cubes.
Performance Management Architect enables administrators to perform the following tasks:
- Visually link and manage applications.
- Use dimensions and attributes across multiple applications. (For example, you can create one account dimension and use it in multiple applications.) Performance Management Architect leverages existing applications and dimensionality to spin off other applications with previously constructed dimensions.
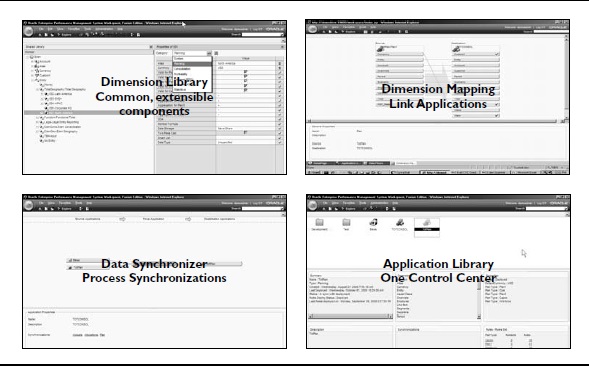
Figure 28. Interfaces for the components of Performance Management Architect
- Graphically manage data flows
- Perform impact analysis—graphically view and model relationships across applications.
- Handle and evaluate the impact of exceptions and changes to all models.
- El iminate manual dimensional and data reconciliation between applications.
Performance Management Architect has four main components for performing these tasks: a dimension library, dimension mapping, data synchronizer, and the application library. Figure 28 shows the interfaces for each of the components.
Architecture of Performance Management Applications
Planning and Profitability and Cost Management are multitiered, web-based applications. Figure 29 breaks down the products into their required components.
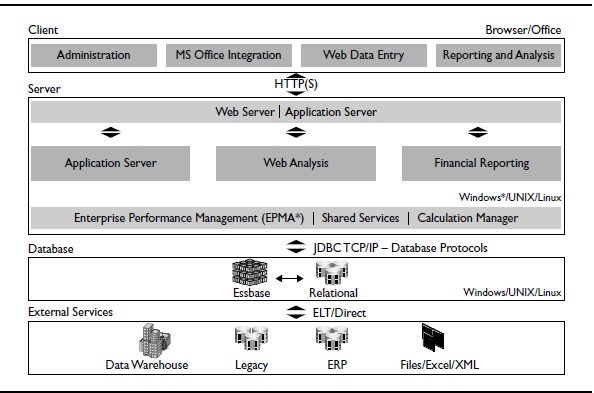
Figure 29. Architecture of the performance management applications.
As shown in Figure 29, the architecture has the following tiers:
- Client tier The client tier consists of the Oracle Enterprise Performance Management Workspace (EPM Workspace) web client. The EPM Workspace provides a centralized interface for viewing and interacting with content created using the Oracle Enterprise Performance Management System, including financial applications and reporting content. In addition to viewing and interacting with content, administrators can manage the application through the EPM Workspace.
- Server tier This tier primarily consists of the application server (Planning and Profitability and Cost Management) and the web server. A Hyperion Reporting and Analysis or Hyperion Web Analysis server is optional. The web server, which can be on a separate machine or on the same machine as the application server, lets you access Planning applications from a web client. It uses standard HTTP as the communications protocol and uses Windows security authentication. Client access to the web server is delivered through a standard web browser.
- Database tier This tier consists of a relational database management system (RDBMS) and Essbase.
This concludes our coverage of the packaged performance management applications. With Planning and Profitability and Cost Management, you gain all the advantages of a packaged application, without sacrificing the speed and power of Oracle Essbase.


