 The purpose of describing this maturity model is to provide a framework to guide organizations in establishing analytical capabilities in an incremental manner. It is also a good way to organize the use case within such a context.
The sample application in this article is intended to show how you can use Oracle Endeca to advance analytical capabilities in different stages of the maturity journey. The application is composed of the following function areas:
- Claims analysis
- Patients analysis
- Operations analysis
- Partners
- Clinical research
- Remote monitoring
FIGURE 2 shows an overview of the application. Each of the functional areas is in its own page.
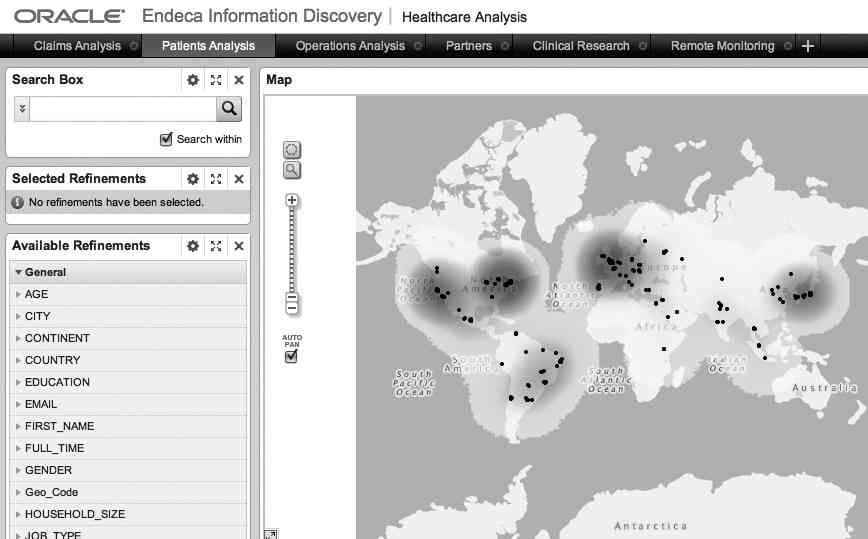
FIGURE 2. Overview of healthcare analytics application
We will discuss architecture characteristics of each stage for the healthcare analytics application and use one example in these functional areas to highlight some of the Endeca features. The tab that is selected in FIGURE 2 is the Patients Analysis component. We’ll cover each of these subject areas in the next sections of this blog.
Claims Analysis
Healthcare companies in the early stages of analytical capability face tremendous challenge. It takes time and effort to build an enterprise data warehouse. Meanwhile, the business urgently needs better data for improved decision making. In the case where an enterprise data warehouse is not yet in place, Endeca can be used as a starting point to integrate different data sources for analysis with quick time to value.
In the Claims Analysis function of the case study, you will integrate three data sources: claims, labs, and drug information. In this example, the claims data has been enriched with an external medical thesaurus with detailed procedure definitions and condition descriptions based on the IDC diagnostic code and procedure code. Use Endeca Integrator ETL to integrate these data sources into an Endeca data domain called HealthCare.
We covered Endeca Integrator ETL in this 4 and this blogs, so we won’t be going over the details of how to develop and configure this ETL graph. Figures 3 and 4 show the final configuration of the Endeca Integrator ETL graph and the run statistics.
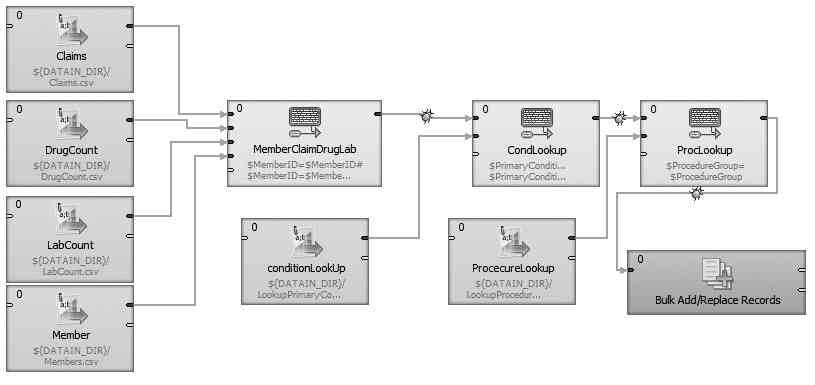
FIGURE 3. Claims Analysis graph
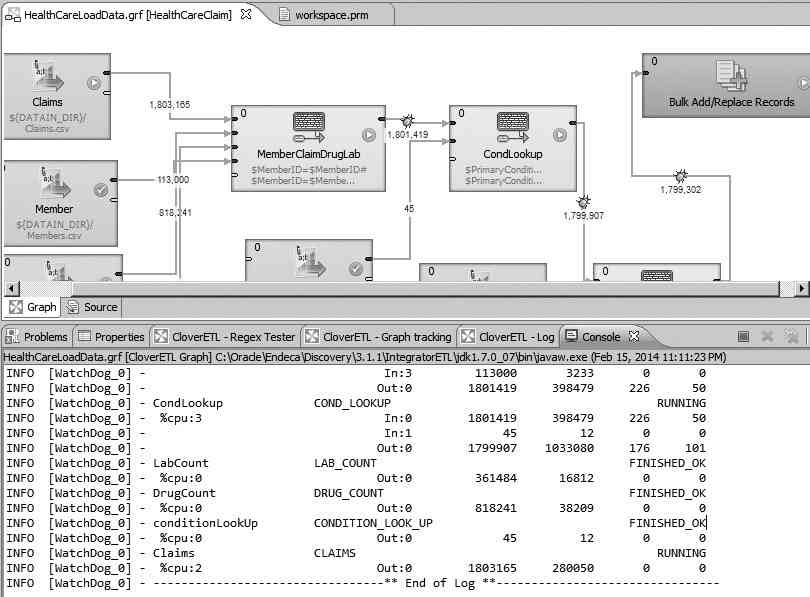
FIGURE 4. Claims Analysis run statistics
To follow along, create an application using a prebuilt Endeca Server option in Endeca Studio. A default two-column application will be created based on the data. You can then organize the refinement area based on the attribute groups, as shown in FIGURE 5.
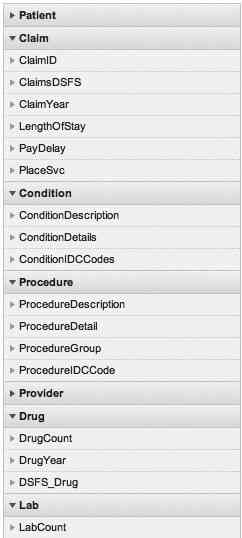
FIGURE 5. Claims Analysis refinement groups
Attribute groups are a good way to organize attributes and can be defined in Application Settings or by preloading configuration files via Integrator.
In the top portion of the right panel, you create a tag cloud group by adding a new Component Container with a two-column (50/50) configuration, as shown in FIGURE 6.
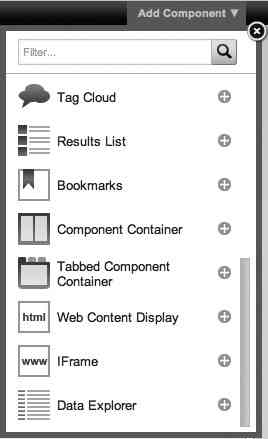
FIGURE 6. Adding a Component Container
You then add two tag clouds, one for condition description and one for procedure description. This allows a side-by-side comparison of the most common conditions with the most performed procedures, as shown in FIGURE 7.
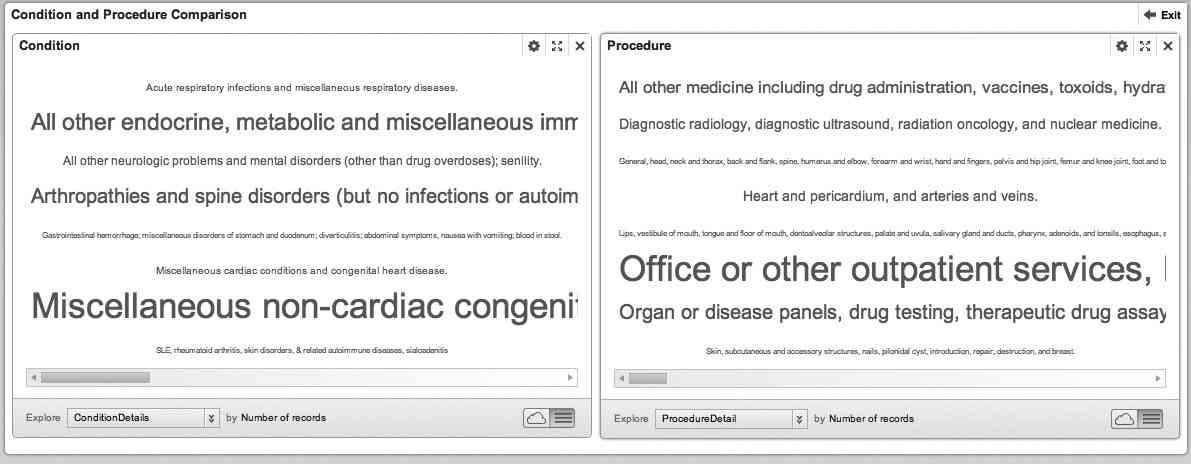
FIGURE 7. Condition and procedure description comparison
You also create a chart group to display different breakdowns for user-driven analysis, as shown in FIGURE 8.
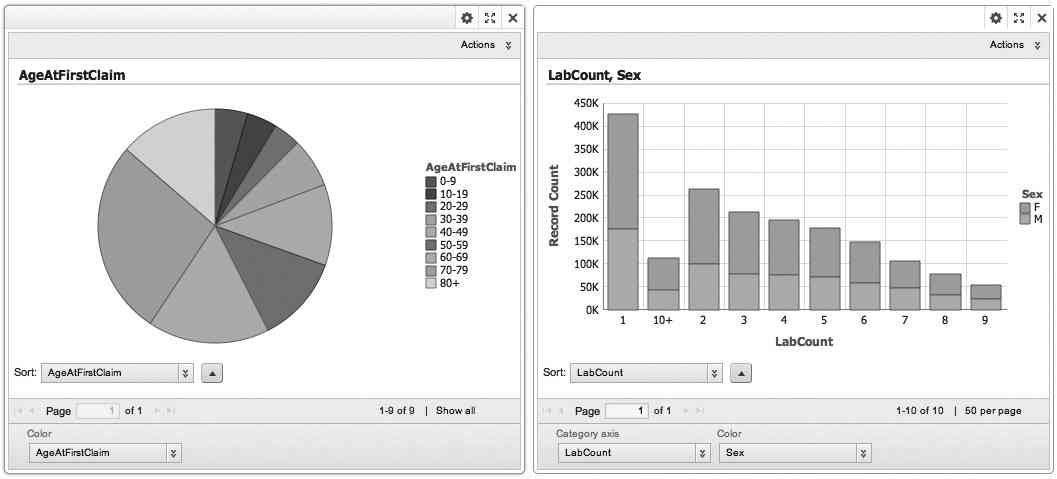
FIGURE 8. Charts for user-driven analysis
The charts are configured to allow analysts to select any dimensions to understand the breakdowns such as age at first claim, places served, drug count, lab count, length of stay, and so on. Users can drill into these specific areas to refine selections and compare attributes to understand the historic trends of claims.
Last but not least, a results table is configured to allow analysts to examine the records in detail as needed. As you’ll notice in FIGURE 9, the results table is automatically configured based on the same attribute groups defined and displayed in the Available Refinements section shown earlier in FIGURE 5. It allows for ease of analysis and enhances productivities for data analysts.
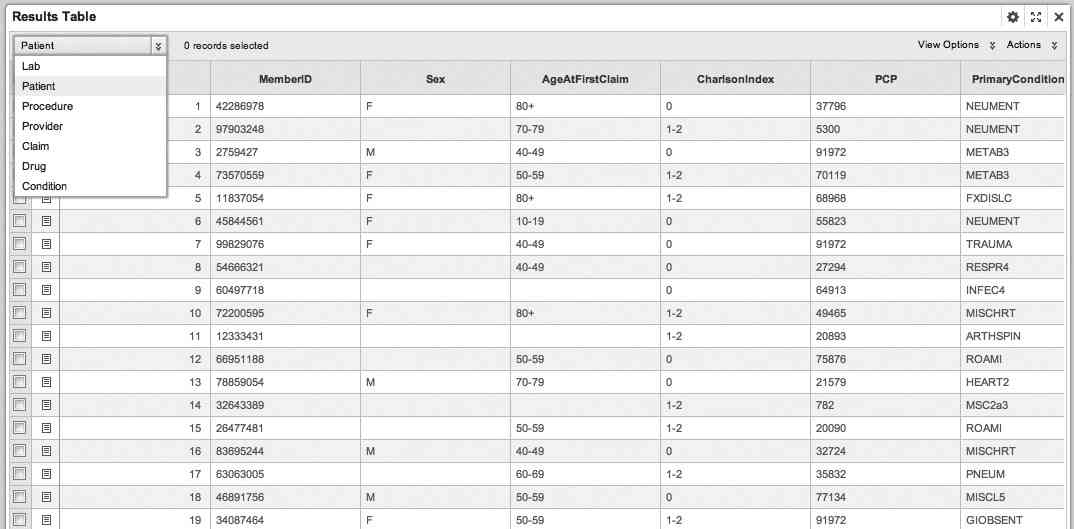
FIGURE 9. Claims results table
You can complete an application like this in Endeca in a matter of hours or days instead of weeks or months using a traditional BI approach. It allows for quick time to value in the early stages of the analytical journey.
Patients Analysis
Master data management is one of the key indicators that an organization is moving toward maturity in its information architecture. The intention of this book is not to teach you how to develop a patient master. Rather, we will show you how to integrate Endeca with master data hubs such as a patient registry.
As you might have noticed in the “Claims Analysis” section, you haven’t yet included detailed patient information. You have joined claims, labs, and drug information by matching on the patient ID. However, there are different patient attributes in each of these data sets that are not aligned or standardized. Let’s assume the fictitious healthcare provider company has already established a master patient index as it moves into the second stage of the maturity curve. Instead of reinventing the wheel, you will simply leverage the existing master data hub and incorporate the patient registry as a data source in Endeca.
A typical hub-and-spoke master data architecture includes a master data hub, integration architecture, data quality management, data stewardship functions, and data services that subscribe and publish master data into various sources and consumer applications. These master data services will publish mastered patient data to Endeca like they would for other data consumers. For ease of demonstration purposes, we will be loading the extracted patient registry file into Endeca. Once you have a data set, you can create a new tab in the application called Patients Analysis. The patient master data is rather wide and contains many attributes that you do not need for your analysis. So, you’ll modify the view definition to include only the attributes of interest, as shown in FIGURE 10. Another option in lieu of an EQL filter is to load only the data needed for analysis. This is a more recommended approach because it will reduce the size of the index and improve overall performance. Here we are assuming that some of the attributes are not needed for this particular analysis but might be useful for future use.
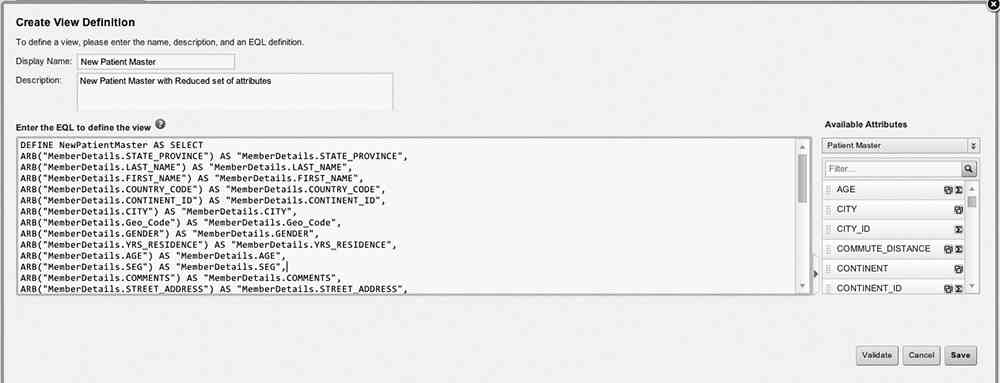
FIGURE 10. EQL for new view definition
Next you’ll configure a map view to display a geographical patient population breakout. First you add a new Map component; then you click the Options button to configure the Map component. Click Patient Master as the data source, and a list of views with geo data type attributes will be displayed for selection. You can choose New Patient Master on the Data Selection tab, Heat Layer on the Layer Type tab, and geo_code as the Points Definition setting. The Layer Property tab allows you to define the layer name, the geo filtering attribute, the size of points, color options, and heat options. You can leave the rest of the configurations with their default settings.
The fictitious healthcare organization used in this case study is global in nature. The default map view gives you a good sense of patient distribution across the globe, as shown in FIGURE 11.
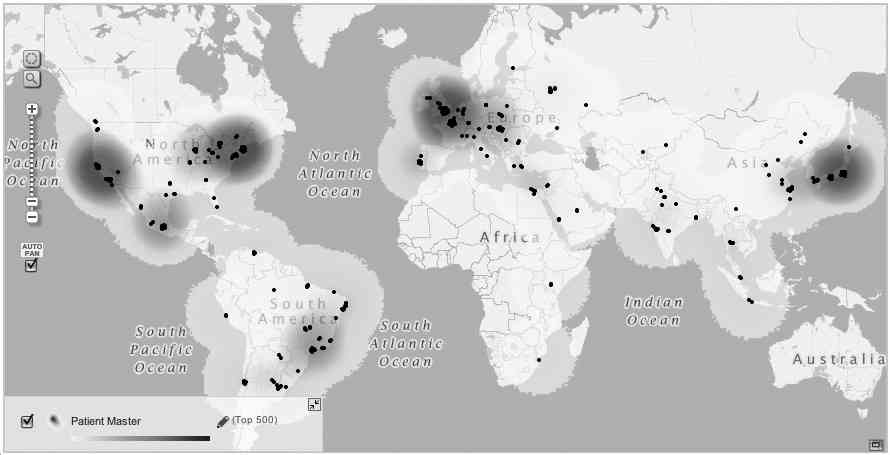
FIGURE 11. Map view of patients’ concentration globally
One of the goals of this analysis is to understand whether the current clinic locations and numbers are sufficient to service the ever-changing patient population. You will start the analysis with the city of Chicago.
First, you upload a new data source that contains clinic locations in the Chicago area. FIGURE 12 displays the attribute definition of this data source.
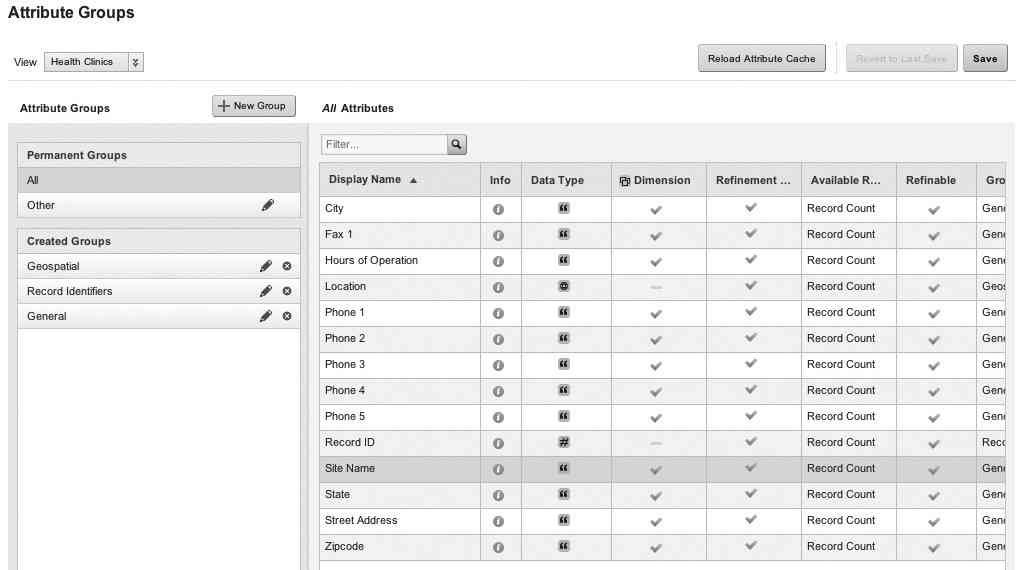
FIGURE 12. Health clinic data source overview
Once you have the new data set for clinical locations loaded, you go back to the Studio page/tab for patients analysis. In the Available Refinements section on the left, select Chicago and submit the selection. The map automatically zooms into the Chicago area. You then click the Options button for the Map Component again to modify the configuration. On the Map Layer definition screen, click the check box before Health Clinic to include it in the map view. Select Numbered Points for Layer Type and Location as the geo attribute. On the Details Templates tab, you replace Record ID with the Site Name attribute so that the clinic name will be displayed instead of a numeric ID. Finally, keep the default settings for the rest of the configuration screens, save the changes, and exit the configuration screen.
FIGURE 13 gives you a clear view that certain areas such as downtown Chicago and the northwest and southeast suburbs lack sufficient coverage of health clinics compared to the patient density in those areas.
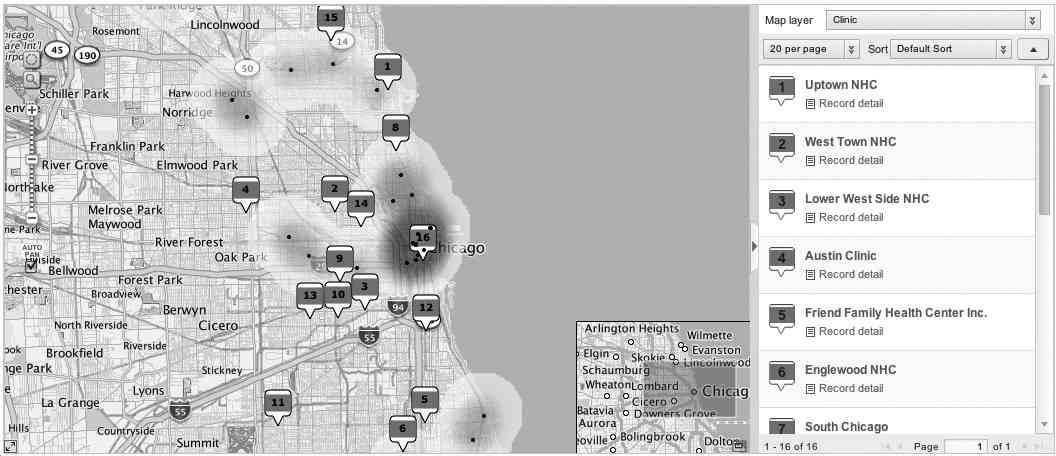
FIGURE 13. Health clinic locations compared to patient density in Chicago
To summarize this section, you are able to use Endeca to consume patient master information and combine it with additional data sources such as clinic and hospital locations for quick and effective analysis of patient population compared to available healthcare facilities.
Operations Analysis
As organizations continue to evolve their analytical capabilities, they will most likely implement multiple business intelligence (BI) tools as a data consumption layer for the enterprise data warehouse.
For organizations that have already implemented various dashboards and reports with a standard BI tool such as Oracle Business Intelligence Enterprise Edition (OBIEE), Endeca allows you to define an iFrame that could link to an existing OBIEE dashboard. FIGURE 14 displays the configuration in Endeca. (We have obfuscated the URL field for security reasons.)
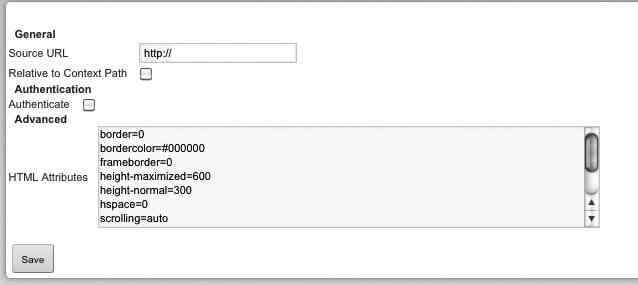
FIGURE 14. iFrame component configuration
FIGURE 15 shows an embedded OBIEE dashboard for profitability analysis. All OBIEE controls are available within the Endeca frame based on security and permission settings for the given user. This feature of Endeca enables the seamless integration of data analysis across different analytical platforms and allows an organization to maximize its existing investment in BI and departmental analytical solutions without having to reinvent the wheel.
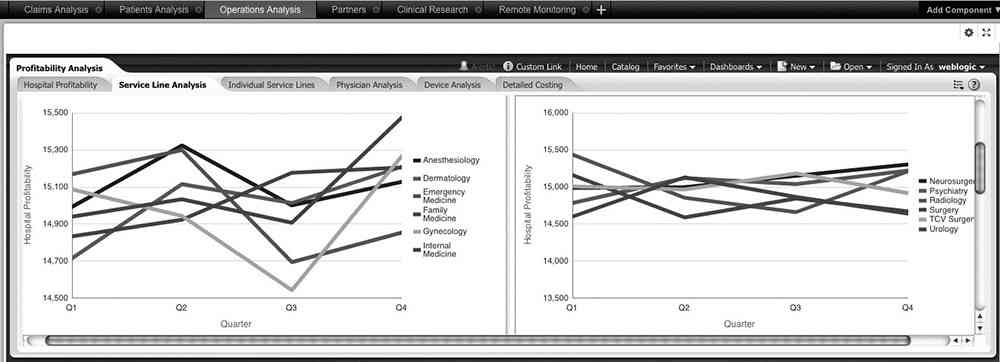
FIGURE 15. Embedded OBIEE profitability analysis dashboard
Partners
In the previous section on operations analysis, we showed you Endeca’s ability of integrating analytics through the consumption layer. Integration with an existing BI tool can also occur at the metadata layer. If you don’t want to display a prebuilt report or dashboard in your Endeca application, you can extract data through an OBIEE metadata repository (or Common Enterprise Information Model). This method ensures the sharing of common definitions between these analytical tools. Next, we will show the step-by-step instructions on how to extract partner information from OBIEE subject areas.
In the Control Panel, go to Data Source Library under the Information Discovery section. Click the + New Data Source button. In the Define Connection section, select Oracle BI. Enter a data source name, description, and connection information accordingly, as shown in FIGURE 16.
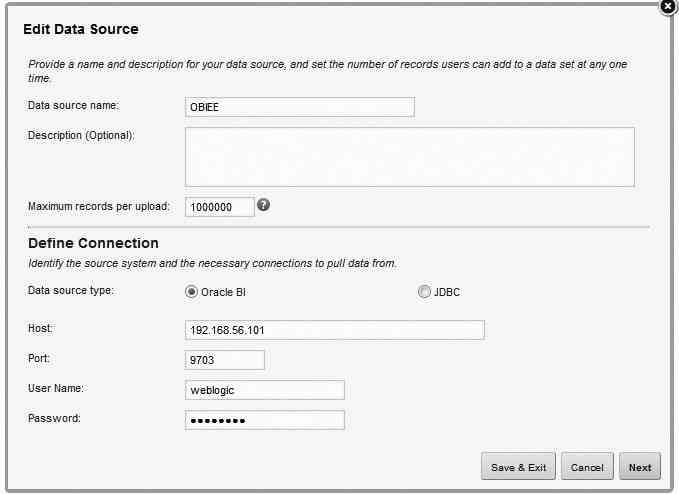
FIGURE 16. Adding a new Oracle BI data source
Click the Next button. Endeca will connect to the OBIEE metadata repository and prepopulate the Subject Area drop-down list with available subjects based on the privilege of the login user account you have provided. Select the subject area on the next screen, as shown in FIGURE 17.
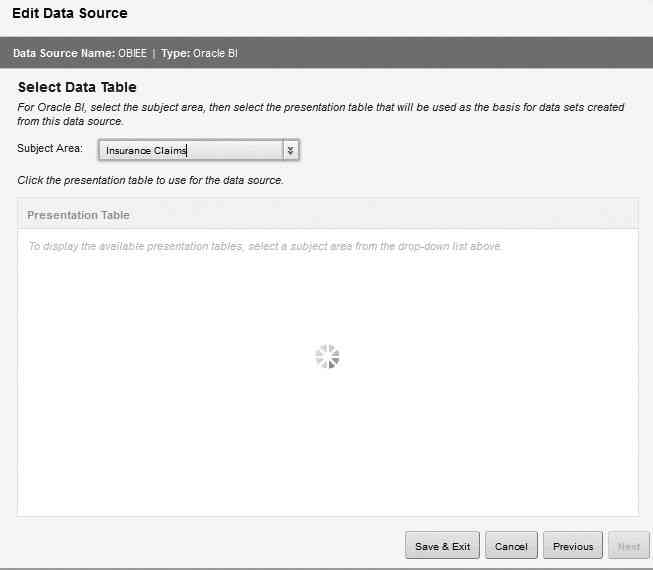
FIGURE 17. Selecting the subject area
Based on the selected subject, Endeca will again read the OBIEE repository and populate the list of available presentation tables. Select one of the presentation tables in the list. In this case, you can select the Partner table (see FIGURE 18).
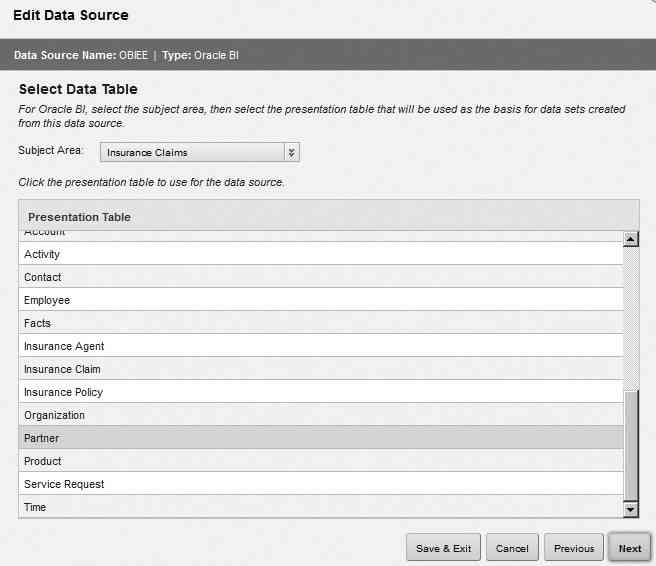
FIGURE 18. Selecting a presentation table
Click Next and Finish, and the newly defined OBIEE connection will be displayed in the data library list, as shown in FIGURE 19.

FIGURE 19. New OBIEE connection available
Now you can create a new data set in the healthcare analytics application. As you will notice in Figure 20, a new option is now available—Load Data from a Database.
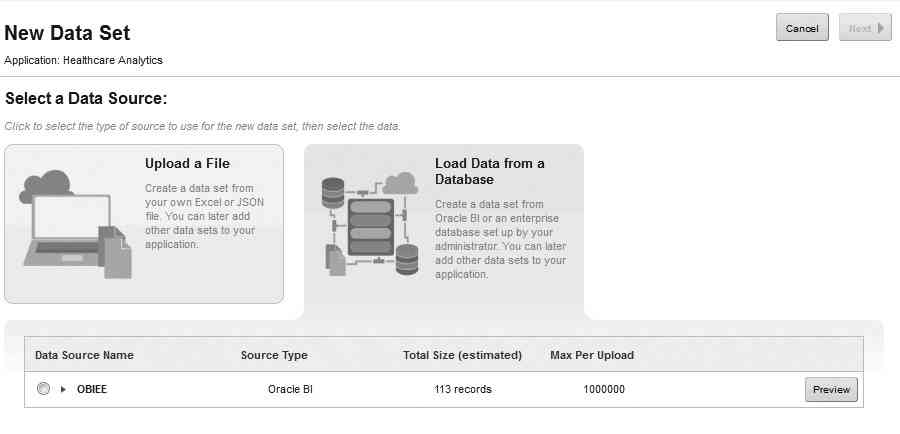
FIGURE 20. Creating a new data set using an OBIEE data source
Endeca will promote user authentication information, as shown in FIGURE 21, to ensure the application user has the proper credentials to access this data source.
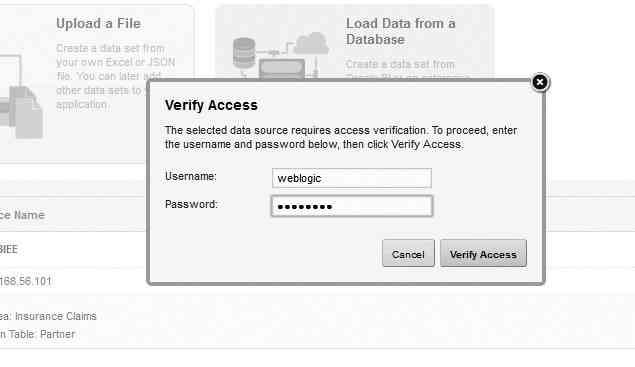
FIGURE 21. Authentication screen to connect to OBIEE
The data set will be imported from the underlying data warehouse through the OBIEE metadata repository for further definition, as shown in FIGURE 22. The steps beyond this are similar to importing data from an Excel or JSON file.
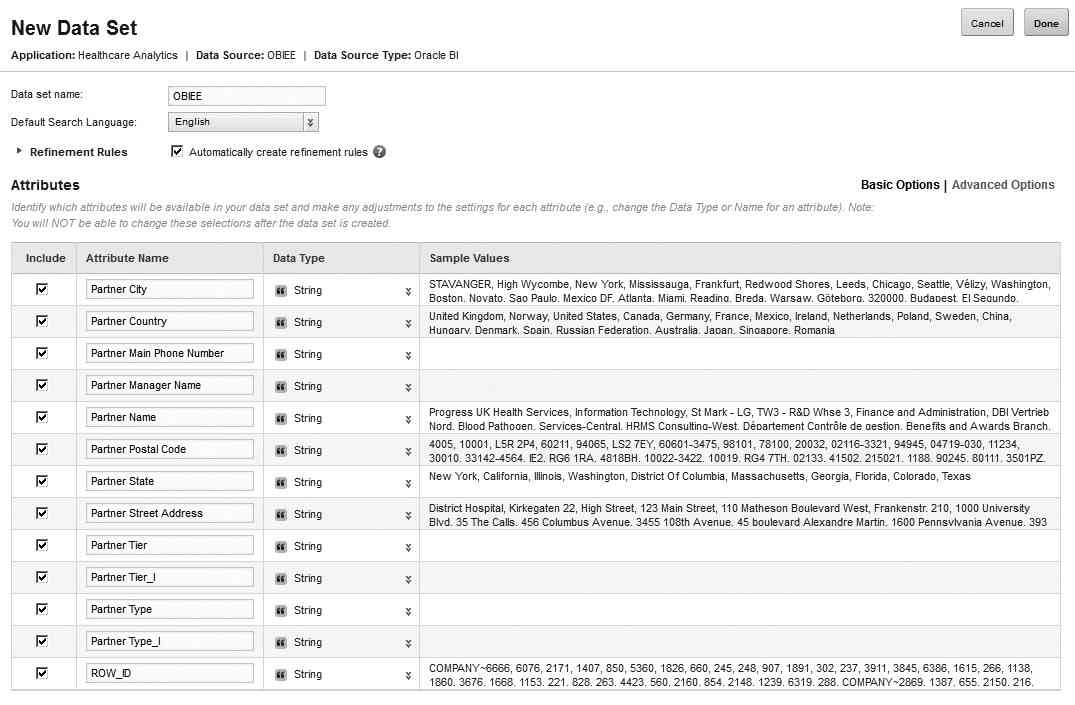
FIGURE 22. Attribute definition imported from OBIEE
Once the data set is loaded, the Partner screen is now ready for use, as shown in FIGURE 23.
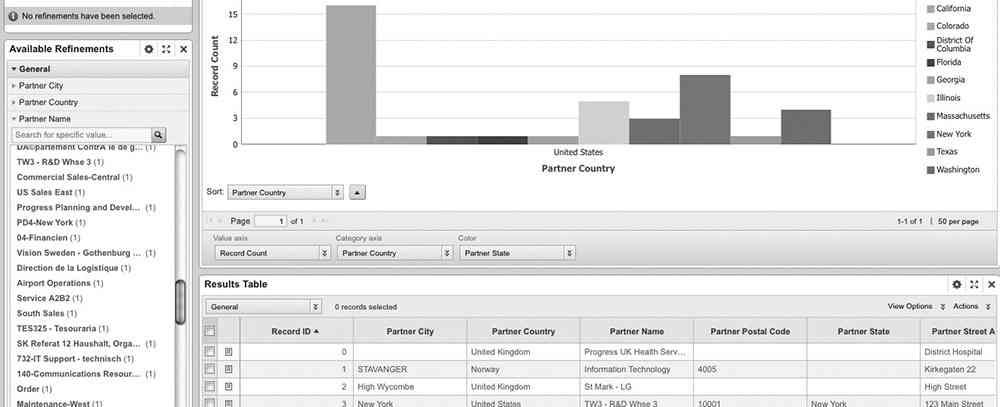
FIGURE 23. Partner screen
This capability of Endeca is unique and valuable. It enables an organization to share metadata across various analytical tools to enforce data standardization and governance. In addition, it allows for quick time to value for extending analytical capabilities.
Clinical Research
Many healthcare organizations are using analytics to enhance and facilitate clinical research as they continue to mature their analytical capabilities. In this section of the use case, we’ll demonstrate how to integrate Endeca with another product within Oracle’s analytical portfolio, called Oracle Data Mining (ODM) for predictive analytics. ODM is part of the Oracle Advanced Analytics (OAA) option for Oracle databases. The other component of OAA is Oracle R Enterprise (ORE). Oracle Big Data Handbook, published by Oracle Press, covers these two products in more detail.
The data source for this use case is based on lung cancer surgical results. FIGURE 24 shows a snippet of the data.
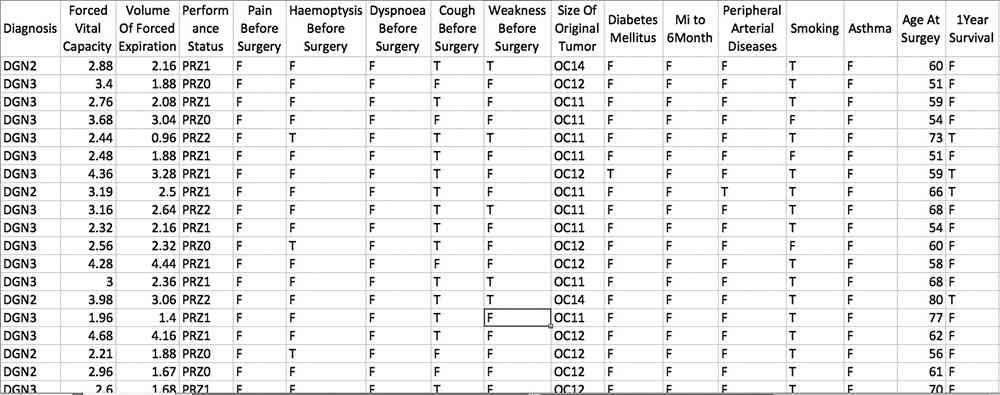
FIGURE 24. Lung cancer surgery data set
You load this data set into an Oracle database and use Oracle Data Mining to generate a statistical model that can be used to predict the potential outcome for future patients. You first define and run a data exploration workflow in ODM, as shown in FIGURE 25.

FIGURE 25. ODM data exploration workflow
ODM outputs a screen that allows you to explore the correlation of each of the attributes with the defined outcome, which is the one-year survival in this case, as shown in FIGURE 26.
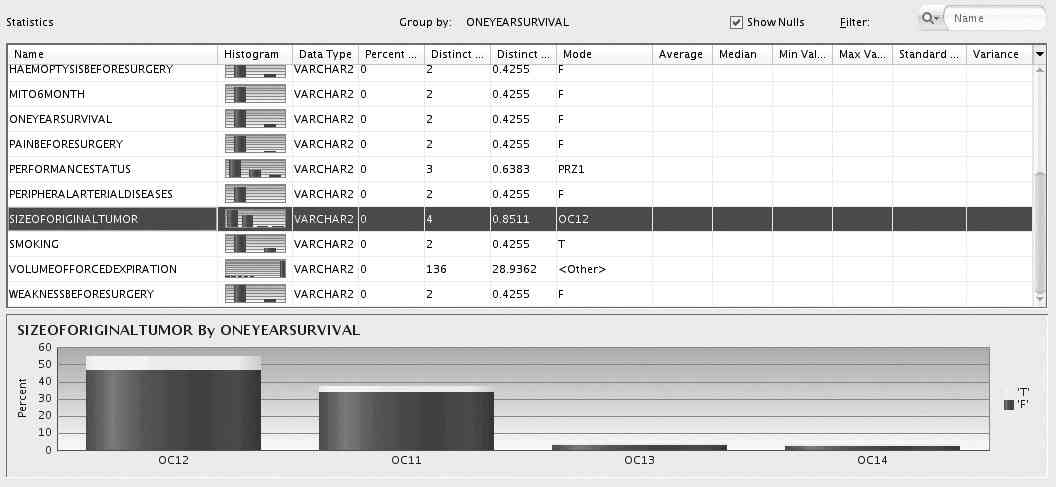
FIGURE 26. ODM data exploration for initial correlation
This capability allows a data scientist to gain an initial understanding of the data set at hand and define a modeling strategy. Next you create and run a class build component in ODM workflow, as shown in FIGURE 27.
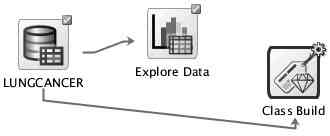
FIGURE 27. ODM Class Build workflow
The output of the ODM Class Build workflow is the comparison window in FIGURE 28. It provides details pertaining to overall accuracies, confidence levels, and cost models for each of the algorithms, allowing a data scientist to compare and choose the best algorithm.
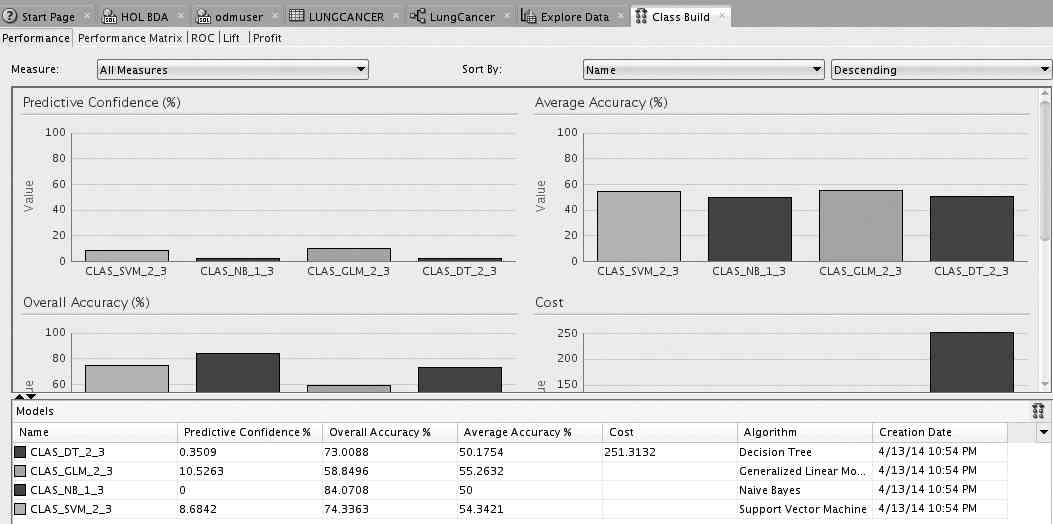
FIGURE 28. Class Build comparison
Based on this comparison information, we decide to use Support Vector Machine (SVM) for our modeling. More information about the SVM and other classification algorithms can be found at the Oracle Technology Network Advance Analytics site as well as the Oracle documentation called “Oracle Data Mining Concepts.” FIGURE 29 shows the final workflow configuration.
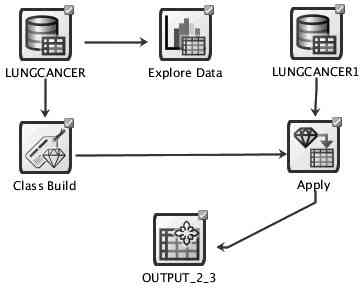
FIGURE 29. ODM workflow final design
The output of the analytical model can be consumed within Endeca, just like any other data source. Clinical research analysts can consume the predictive analytics output within Endeca to compare historic trends and the patient profile. They can slice and dice the data by selecting different attributes within the Endeca chart components, as shown in Figures 30 and 31.
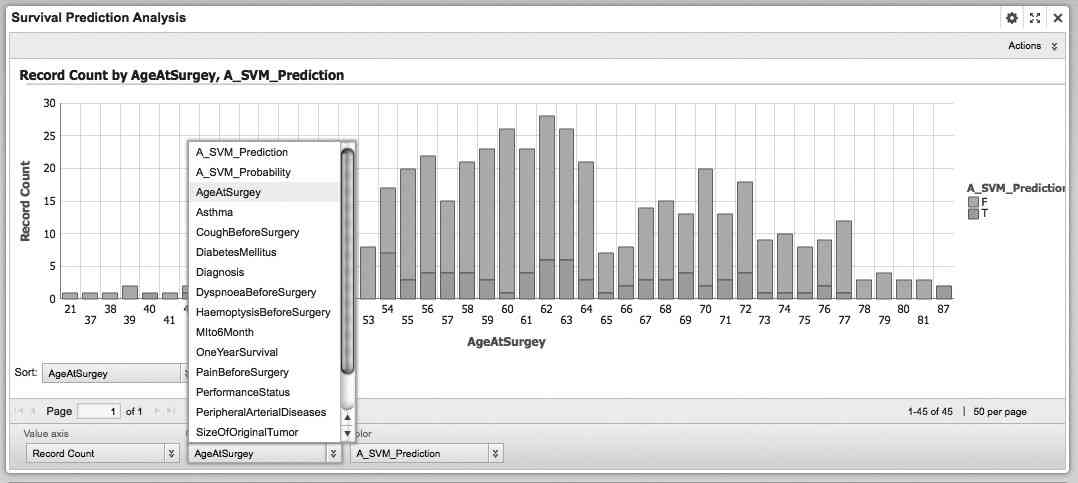
FIGURE 30. Survival prediction analysis
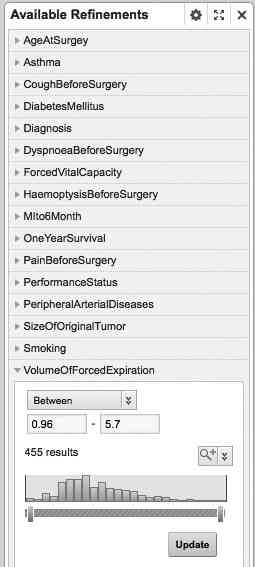
FIGURE 31. Refinement with range values
In this case, Endeca is an effective tool to incorporate predictive analytics that allows you to determine the effectiveness of different treatment options for different patient populations, provide a basis for continuous clinical improvements, and eventually advance patient care outcome.
Remote Monitoring
Parkinson’s disease (PD) is one of the most devastating degenerative disorders of the central nervous system. Caring for PD is an ongoing process. Doctors may recommend regular follow-up appointments with neurologists trained in movement disorders to evaluate patients’ condition and symptoms over time and track the disease progression. Traditional tests and measures require frequent onsite visits and are costly and difficult to implement for the long term.
Various research studies are in place to better diagnose, manage, and eventually conquer this disease. Scientists looking for the cause of PD continue to search for possible environmental factors, such as toxins, that may trigger the disorder and to study genetic factors to determine how defective genes play a role. Other scientists are working to develop new protective drugs that can delay, prevent, or reverse the disease. One such research project is called Parkinson’s Voice Initiative (PVI). Led by a few research specialists at the University of Oxford, the PVI team has developed methods for detecting and tracking Parkinson’s disease progression from voice recordings. In a published paper, they were able to demonstrate the ability to perform Unified Parkinson’s Disease Rating Scale (UPDRS) assessment remotely using self-administered and noninvasive voice recordings. This method has the potential to significantly cut down on costs for ongoing symptom tracking, and it promises the feasibility of frequent, remote, and accurate UPDRS tracking.
In the Remote Monitoring portion of the sample healthcare application, you can set up Endeca to consume the telemetry data set from the Parkinson’s disease voice recording captured through the At-Home-Testing-Device (AHTD). Here’s a high-level overview of the data capturing, transmitting, and consumption process:
- Parkinson’s patients speak into the microphone at their homes.
- At-Home-Testing-Device (AHTD) records speech.
- The speech signals are transmitted to a dedicated clinic server hosted in the medical center via the Internet.
- Speech signals are processed and mapped to UPDRS.
- Predicated UPDRS results, as well as voice recording details, are imported into Endeca.
As always, Endeca creates an application based on the data with the default two-column display. You can add a new Summarization Bar component on the top of the screen and define two flags and three summary metrics, as shown in FIGURE 32.

FIGURE 32. Patient monitoring Summary Items list
Figures 33 and 34 show the definition screens for UPDRS Decline flag and Average UPDRS metric, respectively.
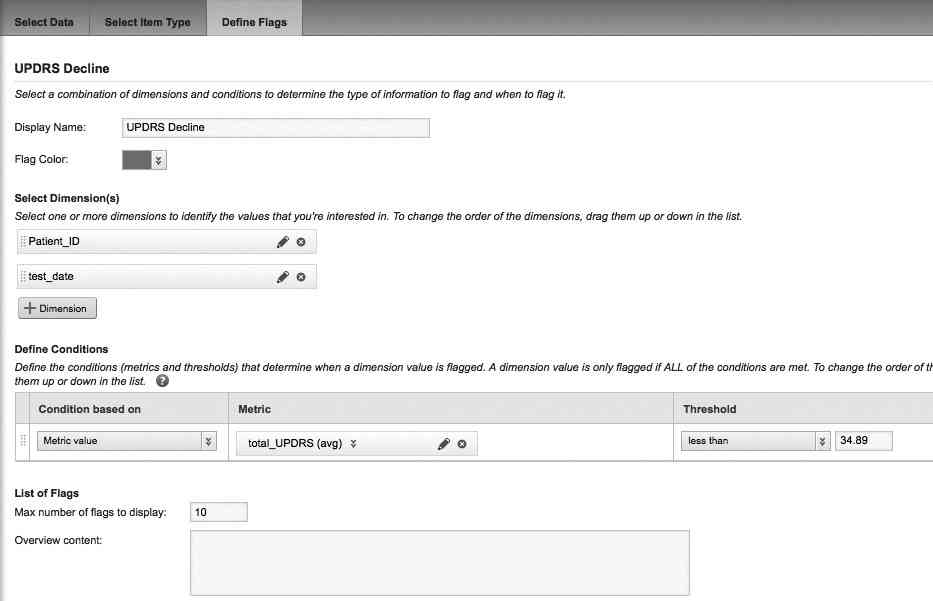
FIGURE 33. Patient remote monitoring flag definition
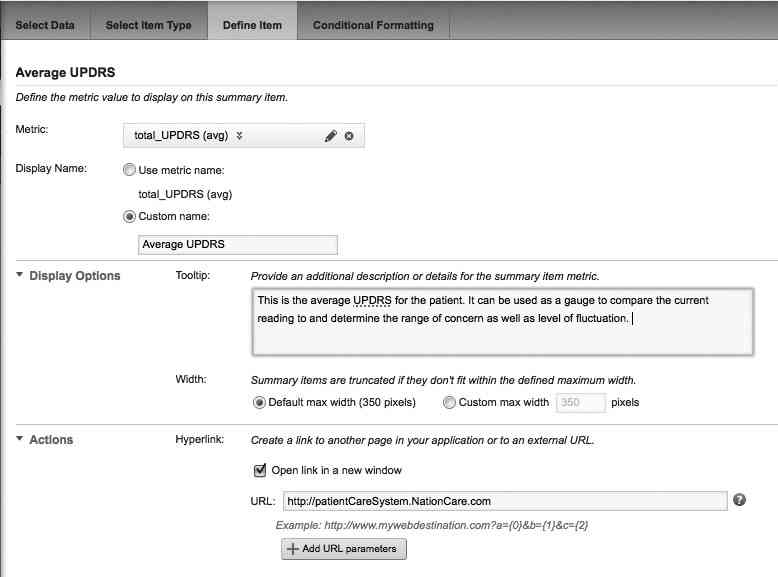
FIGURE 34. Patient remote monitoring metric definition
FIGURE 35 is sample output for one of the Parkinson’s disease patients being monitoring remotely.
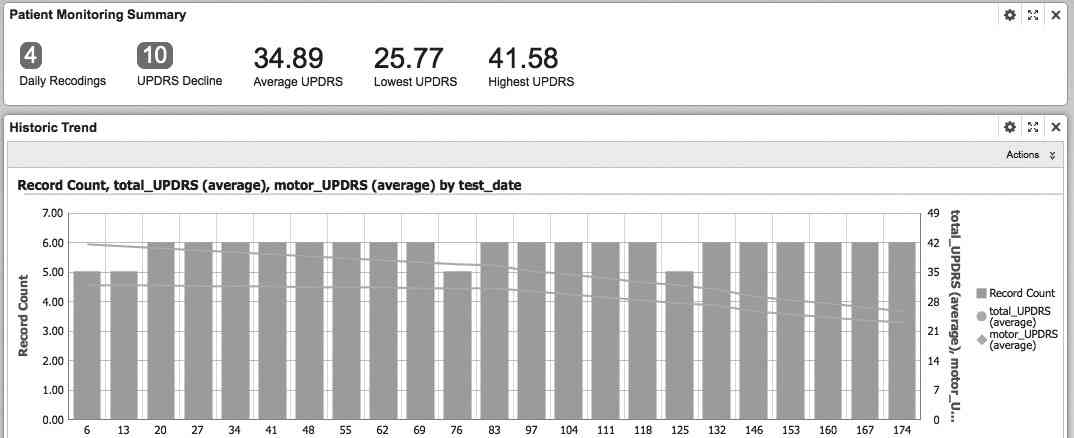
FIGURE 35. Patient remote monitoring output screen
When a clinic staff clicks the flag, more details will be displayed, as shown in FIGURE 36.
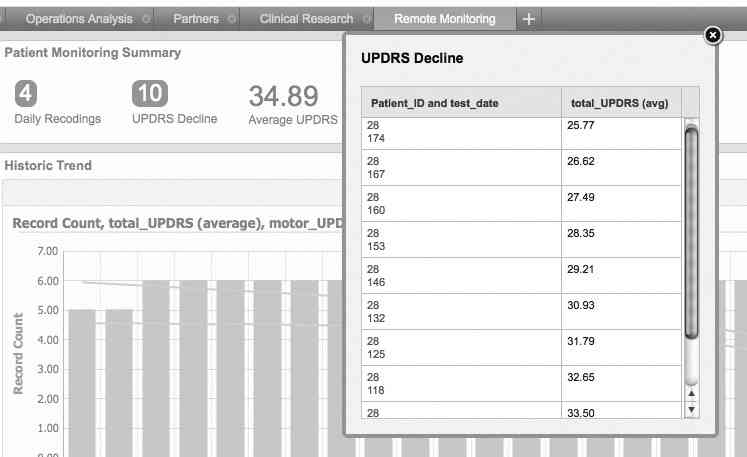
FIGURE 36. Patient remote monitoring flag details
The Actions section in the definition screen, as shown in FIGURE 34, allows you to define a URL for an application that this measure can link to, including URL parameters. It could launch the patient care system with a click of the metric in the Summary Bar, for example, which allows clinical staff to navigate into the clinical management and operational systems for further actions.
With the ever-growing “Internet-of-Things,” remote patient monitoring is becoming more and more economical and effective. Endeca is an excellent tool to consume the telemetry and biometric data from home-monitoring devices and allows clinical staff members to manage the care of their patients through an integrated and holistic view.

