 Let’s take a look at an example of user-driven data exploration with some data available from data.gov, a U.S. federal web site launched in late May 2009, whose stated mission is to increase public access to high-value, machine-readable data sets. A major feature of data.gov is financial data, and the Federal Deposit Insurance Corporation (FDIC) has an interesting data set available. The FDIC is often appointed as the receiver of failed banks, and there is a list of failed banks going to back to October 1, 2000, available as a comma-separated value (CSV) file, banklist.csv. Endeca Studio does not currently support CSV format files as of version 3.1. The solution is trivial, though: Open the file in a spreadsheet program such as Microsoft Excel and then use the program’s Save As feature to save the file in .xls format for Microsoft Excel.
Data for the FDIC Failed Banks Example
A quick examination of the CSV file in a text editor illustrates how this file is mostly unintelligible:

Data provided in CSV format is always indented to be consumed by a machine source or opened with an application that can, at a minimum, display the data in columnar format. Opening the file in Microsoft Excel, as shown in Figure 1, reveals the structure and makes the data readable, but beyond being able to sort the data by one of the columns, like ST (for state), you cannot really infer much about the data.
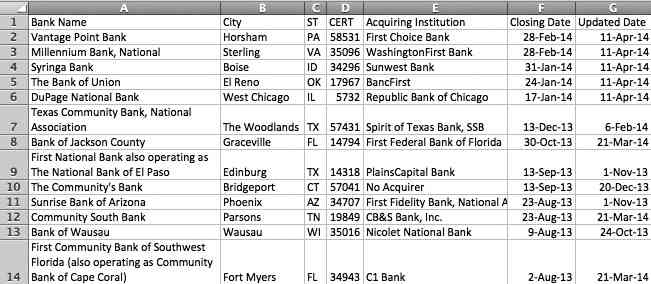
FIGURE 1. FDIC failed banks data in a spreadsheet
Endeca Studio Application Creation for FDIC Failed Banks Data
To follow along, load this file into Endeca Studio and see whether you can get more information from this CSV file data. After you save the data in Microsoft Excel format, you can use it to create an Endeca Studio application. Figure 2 shows the first step in creating an Endeca application from this file. You simply tell Endeca which file to use, and it will display the structure of the file.
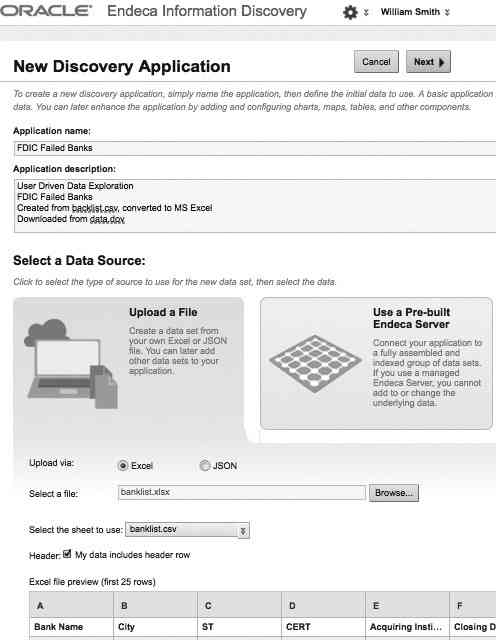
FIGURE 2. FDIC failed banks data, new Endeca application creation
From this screen, click Next to proceed to a screen that allows attributes to be modified. For the FDIC data, you can change the name of the column for the state name to State for readability. Figure 3 shows this web form. Note that the figure shows the Advanced Options features.
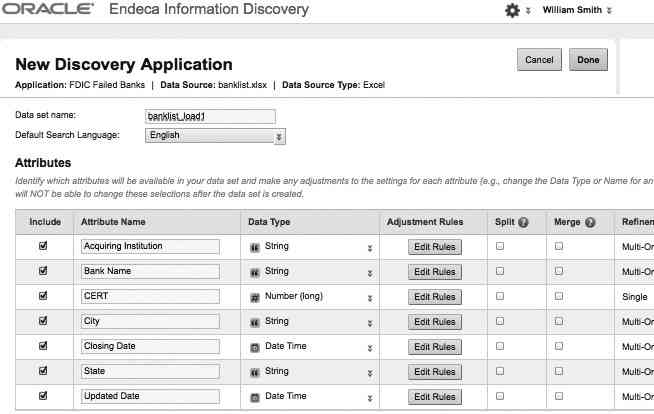
FIGURE 3. FDIC failed banks data, attribute review
This screen allows you to select which attributes are available in the application and also adjust the data set. For now, click Done to create the application from this data. Endeca Studio begins the process of creating the application with a default set of components. This occurs as a background process, as indicated in the message shown in Figure 4. When the application is ready for use, it will appear on the main page.

FIGURE 4. FDIC Failed Banks application, create status
Figure 5 shows the new application with a default set of components. The chart that is created by default shows a record count by acquiring institution. In the FDIC list of failed banks, the acquiring institution is the name of the bank that acquired the failed bank. There are two sort options on this chart. If you select Acquiring Institution by Record Count, you immediately see something fascinating: Out of the total data set, “no acquirer” has the largest record count for Acquiring Institution. This means that the majority of failed banks were not acquired or taken over by other banks.
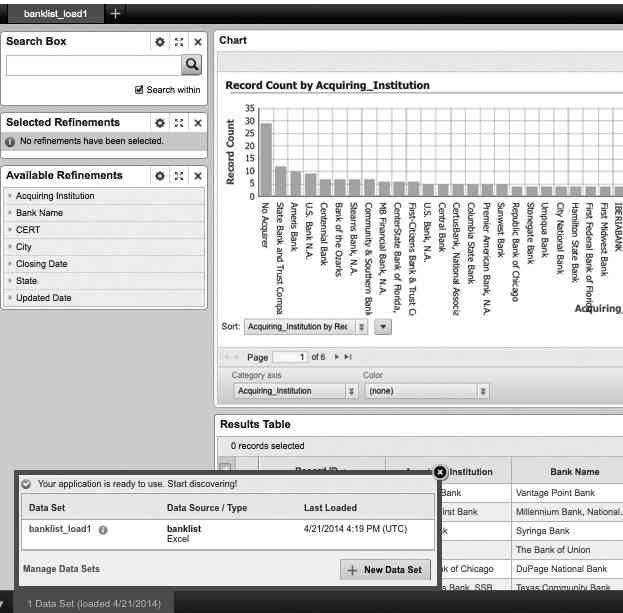
FIGURE 5. Newly created Endeca application with FDIC failed banks data
Tag Cloud for FDIC Failed Banks Data
Enhancing this application is easy. Let’s start by adding a new page by clicking the plus sign near the top of the upper-left corner of the web form. Once you add this new page, you add two important tools for an Endeca application: the selected refinements component and available refinements component. The selected refinements component shows what refinements are currently in effect for your data viewing and visualization components. The available refinements component allows your data to be refined with any attribute in your data set. This component lists record counts for each attribute. In Figure 6, you can see how the available refinements component displays the Acquiring Institution data.
`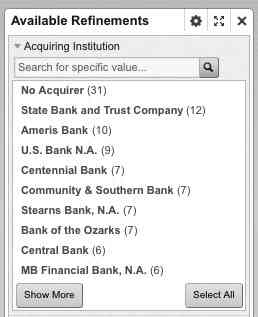
FIGURE 6. Available refinements for acquiring institution
Note that in Figure 6 we have limited the number of values to be displayed in the available refinements component to 10, instead of the default value of 20. The selected refinements and available refinements are part of what is called guided navigation in Endeca Studio. You can always determine what refinements are in effect and remove them with the selected refinements component. The available refinements component allows you to select any available attribute value to narrow the focus of Endeca Studio navigation.
The tag cloud component is similar to the available refinements component in that it allows data to be examined in terms of record count and allows refinements to be applied. The tag cloud component also allows refinements to be cascaded. For example, within the FDIC failed banks data, you can add a dimension for State that has a cascaded dimension of City, as shown in Figure 7. The tag cloud component also supports multiple dimensions, which are selectable with a drop-down selector. For the FDIC data, Acquiring Institution, State, and City are good candidates to use with the tag cloud.
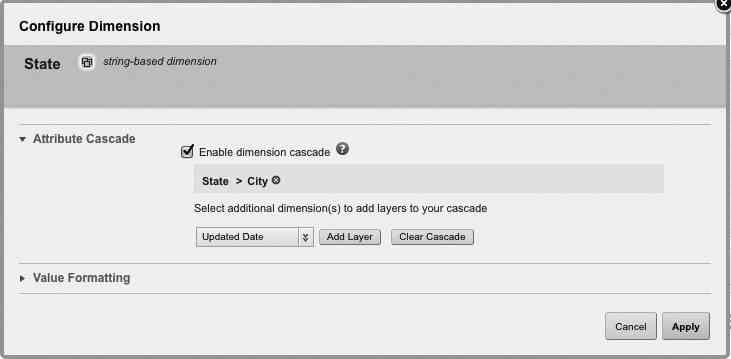
FIGURE 7. Cascaded dimension configuration for tag cloud component
Figure 8 shows the result of the cascaded dimension configuration for state and city.
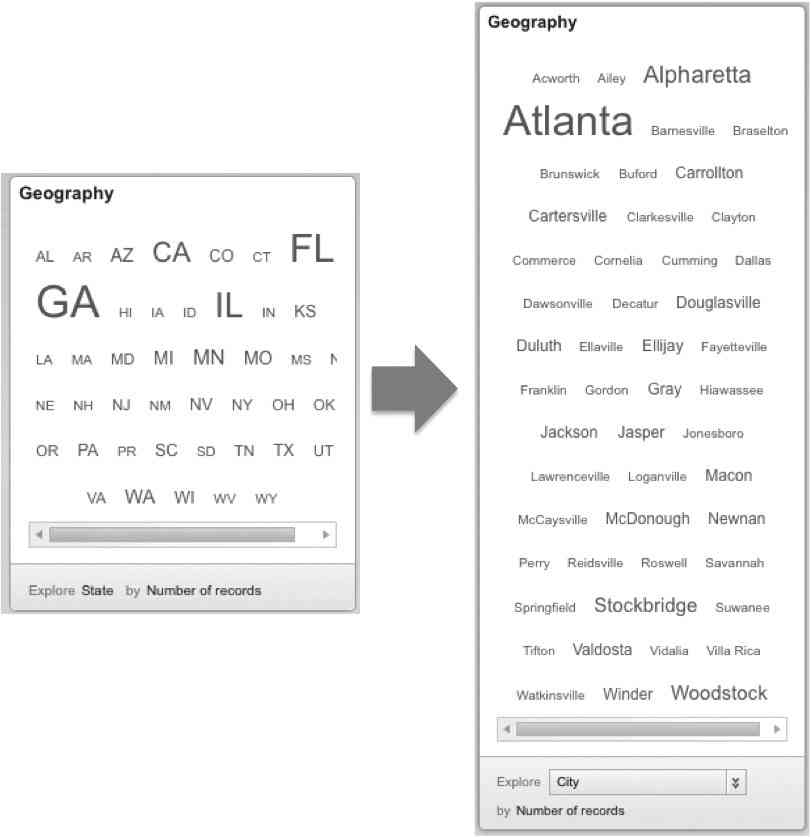
FIGURE 8. Tag cloud for State, with City cascaded
The tag cloud component is useful for showing which dimensions or attribute values have more relevance. They are easy to understand for those who are viewing the Endeca application and are a good option for dashboard functionality. In this example, you can see that the state of Georgia had the most FDIC bank failures, and within Georgia, the city of Atlanta had the most bank failures. Figure 9 shows the page we quickly created with the tag cloud, along with a table view.
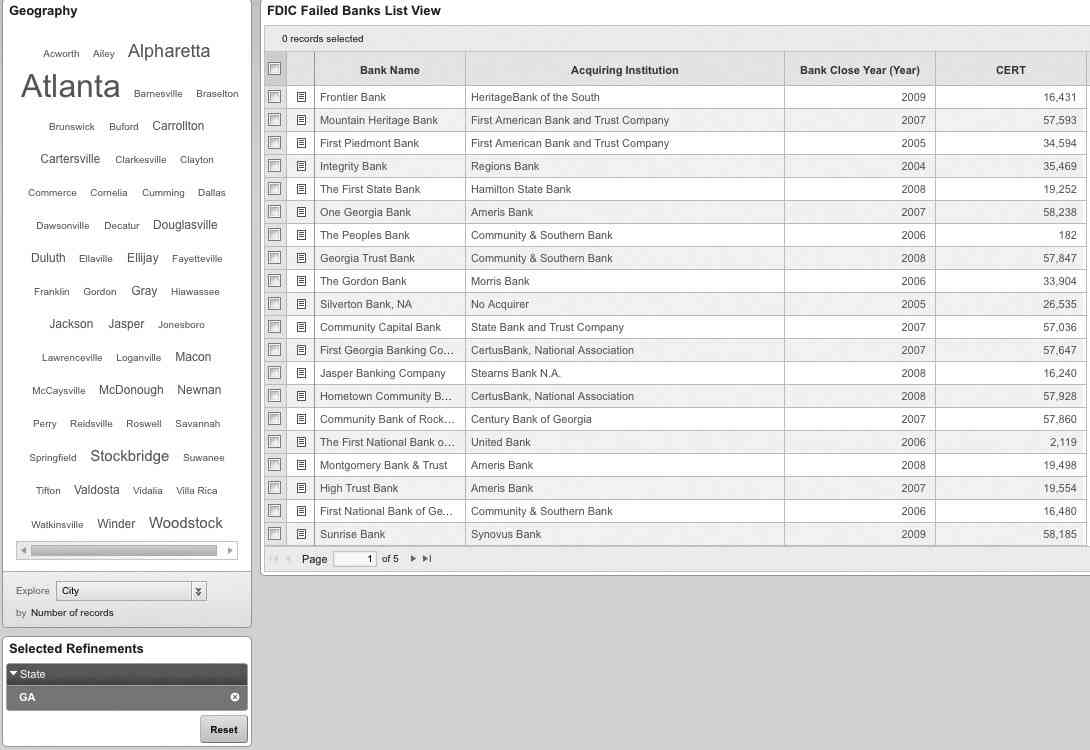
FIGURE 9. Finished web form for FDIC failed banks data
The table view updates as you drill into the data with the tag cloud. The results table has been customized to show only the bank name, acquiring institution, year of failure, and FDIC CERT number.
Map Component for FDIC Failed Banks Data
In this example, we used the tag cloud to display geographic information, and while this works well with the cascaded dimension selection, a component better suited to this purpose is the map component. The map component displays a “heat map” layer on top of a map, for related geography. The FDIC failed banks data is associated only with the United States, but for data that is global in nature, a world map can be displayed. For Endeca Studio to use the map component, the data set must have a dimension of type geo. The geo type contains the location information expressed in latitude and longitude, separated by a space. In the data contained in the file for the FDIC Failed Banks application, you have a city and state and would need to convert this information to a latitude and longitude in order to create a geo type for each record. You can accomplish this type of task, converting city and state to latitude and longitude, in Endeca Integrator ETL with relative ease. For now, Figure 10 illustrates the elegant way the map component displays the results.
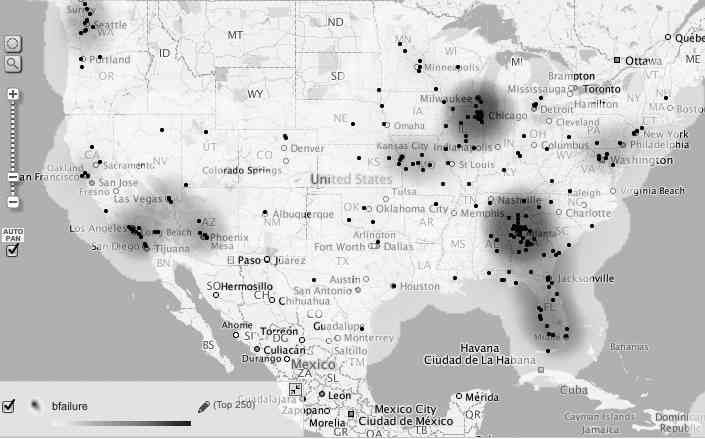
FIGURE 10. Endeca Studio map component with FDIC failed banks data
The map is clickable and allows zooming. In addition, the small circle control near the upper-left corner of the map allows an interesting form of selection, called geospatial range selection. This is shown in Figure 11.
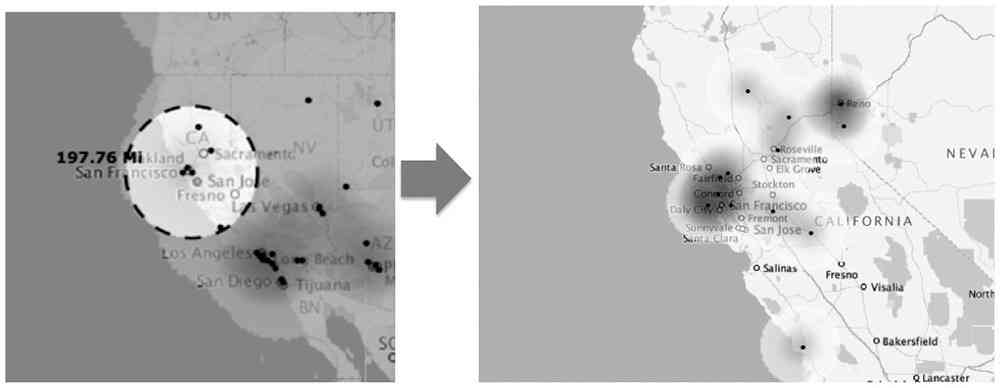
FIGURE 11. Geospatial range selection feature of the map component
Using Enrichments Within Endeca Studio
You can use enrichments within Endeca Studio to enhance the visualization of data, and in the case of the FDIC failed banks data, you will use enrichments to add geographic groups for major regions of the United States. Let’s first review a few essential technical details about enrichments. To use enrichments within Endeca Studio, the data set cannot be read-only. Data sets are set to read-only by Endeca Server administrators, usually to enhance performance. In most cases, a data set will be read-write. Enrichments use the Endeca Server enrichment plug-ins, which are installed with Endeca Server automatically. However, you can use enrichments only if the data enrichment plug-ins have been registered. Registering the data enrichment plug-ins is an installation step that occurs after Endeca Server has been installed and is covered in detail in the installation guide “Oracle Endeca Server: Installation Guide.” Registering the enrichment plug-ins is part of a nominal Endeca Server installation, so you should not have any issues.
Enrichments are used to add attributes to a data set, and two separate and distinct methodologies are provided to accomplish this: the Extract Terms enrichment and Whitelist Text Tagging enrichment. For the FDIC failed banks data, you will be using the Whitelist Text Tagging enrichment. With the Whitelist Text Tagging enrichment, you add attributes to a data set based on specific rules provided to Endeca, based on how you think data should be organized. In this example, you want to add attributes for geographic regions of the United States. You will tell Endeca Studio to add an attribute called Southeast to any record in the data set that has a value of AL, AR, DC, FL, GA, KY, LA, MD, MS, NC, PR, SC, TN, VA, or WV. These are, of course, the two-letter state abbreviations for each state in the southeastern United States.
To add the Whitelist Text Tagging enrichment, you must select Application Settings, select Data Sets on the left side of the web form, and then select Enrichments. After this, select Add Enrichment, which will bring up the New Enrichment window. This process is shown in Figure 12.
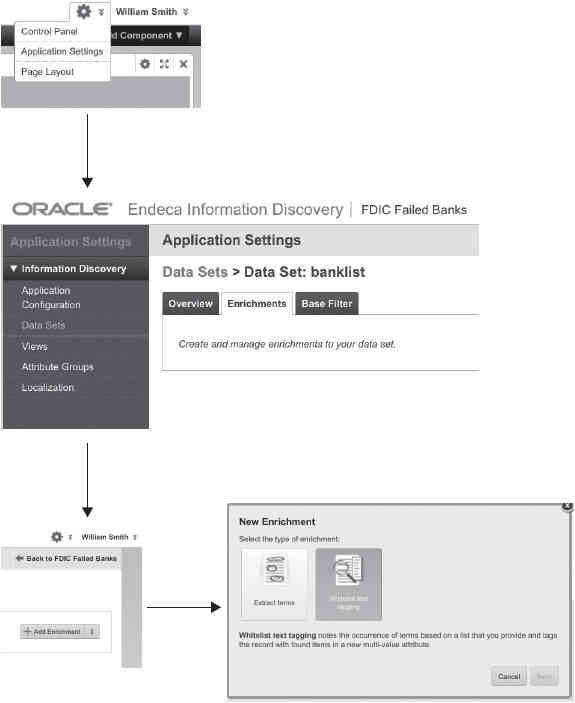
FIGURE 12. Initial steps for enabling the Whitelist Text Tagging enrichment
Click Whitelist Text Tagging and then click Next to begin the process of creating the whitelist enrichment. In this example, you will create a new attribute called Southeast, which will be created from data from the State attribute. In this example, you will enter the whitelist terms on the web form, but it is also possible to upload a text file with the whitelist terms. Selecting Enter Terms and then clicking Edit allows the terms to be entered. Figure 13 shows the steps involved in creating the Whitelist Text Tagging enrichment. Once you’ve saved this configuration, click the play button on the far right to build the enrichment. The enrich ment runs, and during this time, you may not run any other enrichments or make changes to enrichments.
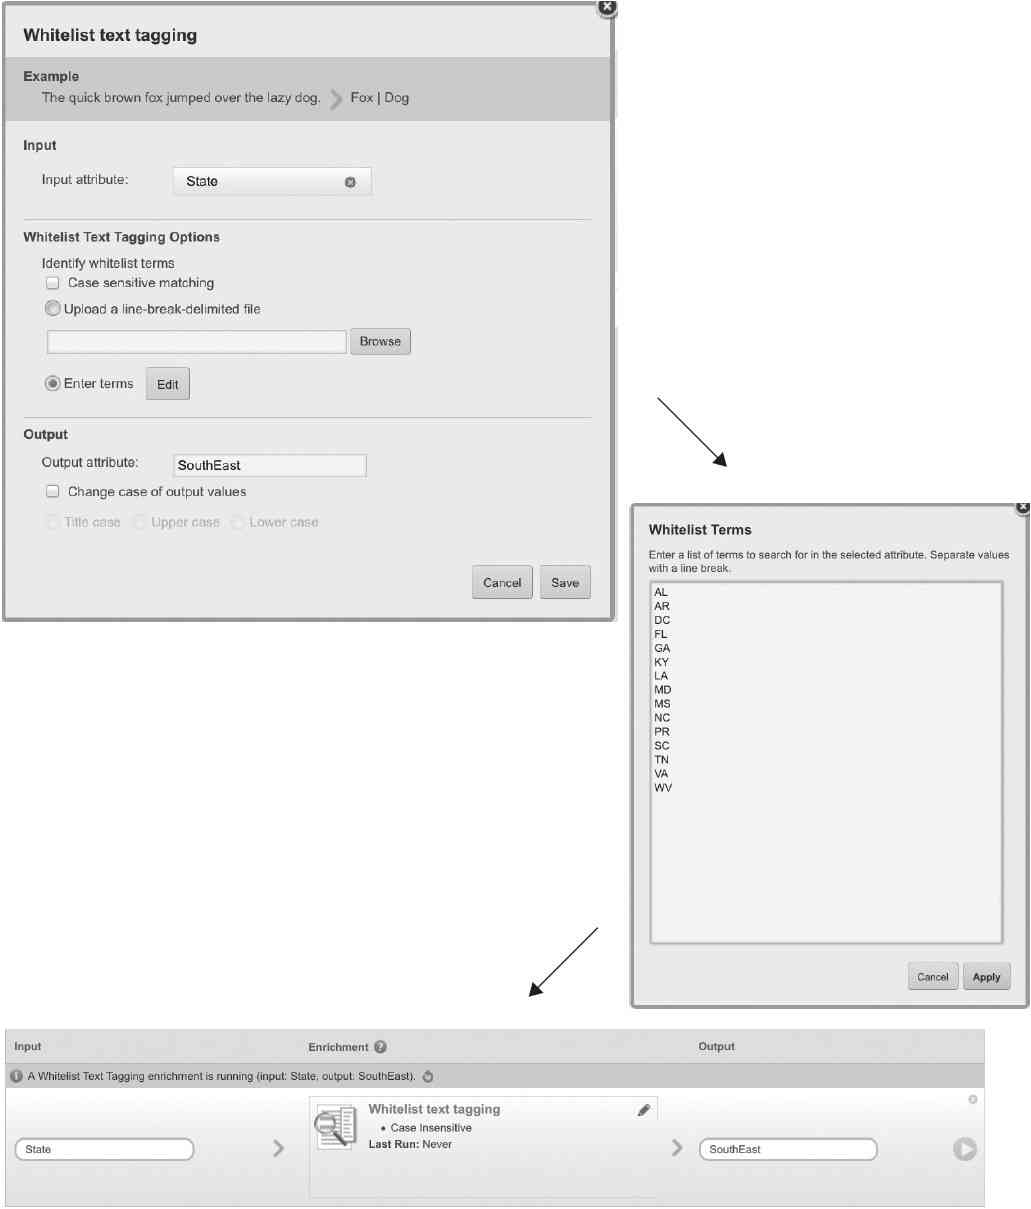
FIGURE 13. Steps for creating the whitelist enrichment
After the enrichment completes, a new attribute named Southeast will be available and is shown in the Available Refinements list. If you create whitelist enrichments for the other regions, you can have a complete list of available refinements for the United States, as shown in Figure 14. To make these new attributes useful as a refinement, select Application Settings and then select Data Sets | Overview | Manage Attributes. Select Multi-Or instead of the default value of Multi-And. This enables you to use the Whitelist Text Tagging enrichment to select all records for an attribute and see the results in the other Endeca Studio components. This is shown in Figure 14.
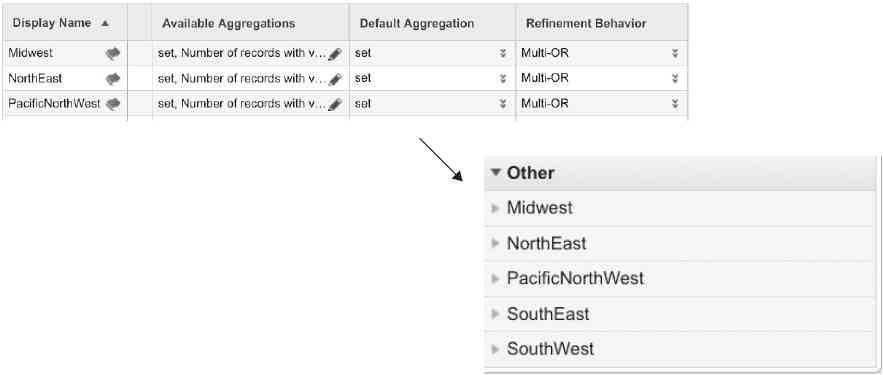
FIGURE 14. Setting refinement behavior to Multi-OR for selection
The benefit of the whitelist enrichment is shown on the dashboard. With this dashboard, you can see pie charts of each region of the United States.
In this example, we have limited the height of the chart to 150 pixels to allow all five regions to be easily visible on one page. Total Bank Failures is indicated on the Summarization Bar, and a tag cloud indicates the acquiring institutions.
One other interesting aspect related to Figure 15 is that this screenshot was captured from an Apple iPad Mini web browser. Endeca Studio applications are well suited for consumption on mobile devices.
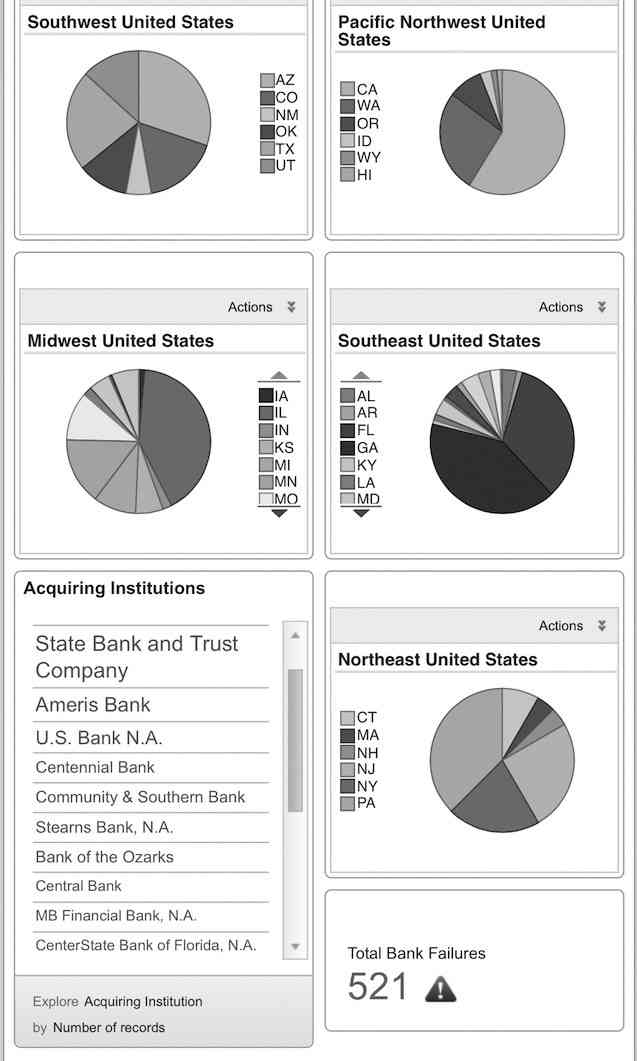
FIGURE 15. Dashboard created using whitelist enrichments
FDIC Failed Banks Data Summary
In the first example, you saw how easy it is to create an application using a Microsoft Excel file from a publicly available data source. With both the tag cloud and the map component, you can easily determine which areas of the United States have had the most FDIC bank failure takeovers. With the whitelist enrichment, you were able to add attributes to the data set for the region of the country and use the chart component to display pie charts for each region.

