
Terms
- Optimization
This generally refers to getting your app and scripts to run as fast as possible. In some cases, we will be optimizing for memory use or something other than speed. But for the most part, when we say “optimize,” we are talking about making things fast.
- Scaling
This term means building an app that can handle more and more stuff. More page views. More visits. More users. More posts. More files. More subsites. More computations.
Scaling can also mean building an app to handle bigger stuff. Bigger pages. Bigger posts. Bigger files.
- Origin
Refers to your WordPress application, which is the source of all of the data coming out of your app. Optimizing the origin involves making your WordPress app and the server it runs on faster.
- Edge
Refers to services outside of your WordPress application, which are further from the origin but potentially closer to your users. These services include content delivery networks (CDNs) as well as things like browser caching. Optimizing the edge involves using these services in a smart way to make the end user experience better.
Origin Versus Edge
Note
Testing
Intel® Xeon® E3-1220 processor
4 Cores x 3.1 GHz
12 GB DDR3 ECC RAM
2 TB SATA hard drives in software RAID
What to Test
- Test a “static” page to use as a benchmark
By static here, we don’t mean a static .html file. The page should be one generated by WordPress, but choose one, like your “about” page or contact form, that has few moving parts. The results for page load on your more static pages will represent a sort of best-case scenario for how fast you can get pages to load on your app. If static pages are loading slowly, fix that first before moving on to more complicated pages.
- Test your pages with all outside page caches and accelerators turned off
You first want to make sure that your core WordPress app is running well before testing your entire platform including CDNs, reverse proxies, and any other accelerators you are using to speed up the end user experience. If you send 100 concurrent connections a page with a full-page cache setup, the first page load might take 10 seconds, and the following 99 may take 1 second. Your average load time will be 1.09 seconds! However, as we discussed earlier, that first 10-second load time is really unacceptable and hints at larger problems with your setup.
- Test your pages with all outside page caches and accelerators turned on
Turning off the outside accelerators will help you locate issues with your core app. However, you want to run tests with the services on as well. This will help you locate issues with those services. Sometimes they will slow down your app.
- Test prototypical pages
Whichever kind of page your users are most likely to be interacting with is the kind you will want to test. If your app revolves around a custom post type, make sure that the CPT pages perform well. If your app revolves around a search of some kind, test the search form and search results pages.
- Test atypical pages
While you should spend the most time focusing on the common uses of your app, it is a good idea to test the atypical or longtail uses of your app as well, especially if you have some reason to expect a performance issue there.
- Test URLs in groups
Some of the following tools (like Siege and Blitz.io) allow you to specify a list of URLs. By including a list of all of the different types of pages your users will interact with, you get a better idea of what kind of traffic your site can handle. If you expect (or know from analytics) that 80% of your site traffic is on static pages and 20% is on your search pages, you can build a list of URLs with eight static pages and two search results pages, which will simulate that same 80/20 split during testing. If the test shows your site can handle 1,000 visitors per minute this way, it’s a pretty good indication that your site will be able to handle 1,000 visitors in a real-world scenario.
- Test URLs by themselves
Testing URLs in groups will make the topline results more realistic, but it will make tracking down certain performance issues harder. If your static pages load in under 1 second, but your search results pages load in 10 seconds, doing the 80/20 split test described would result in an average load time of 2.8 seconds. However, the 10-second load time on the search results page may be unacceptable. If you test a single search result page or a group of similar search results pages, you’ll be better able to diagnose and fix performance issues with the search functionality on your site.
- Test your app from locations outside your web server
The command-line tools described next can be run from the same server serving your website. It’s a good idea to run the tools from a different server outside that network so you can get a more realistic idea of what your page loads are when including network traffic to and from the server.
- Test your app from inside your web server
It also makes sense to run performance tests from within your web server. This way, you remove any effect the outside network traffic will have on the numbers and can better diagnose performance issues that are happening within your server.
Chrome Debug Bar
Open Chrome.
Click the Chrome menu and go to Tools → Developer Tools.
Click the Network tab of the debug bar that shows in the bottom pane.
Navigate to the page you want to test.
You will get a report of all of the requests made to the server.
Scroll to the bottom to see the total number of requests and final page load time.
19 requests | 35.7KB transferred | 1.42s (load: 1.16s, DOMContentLoaded: 1.10s)
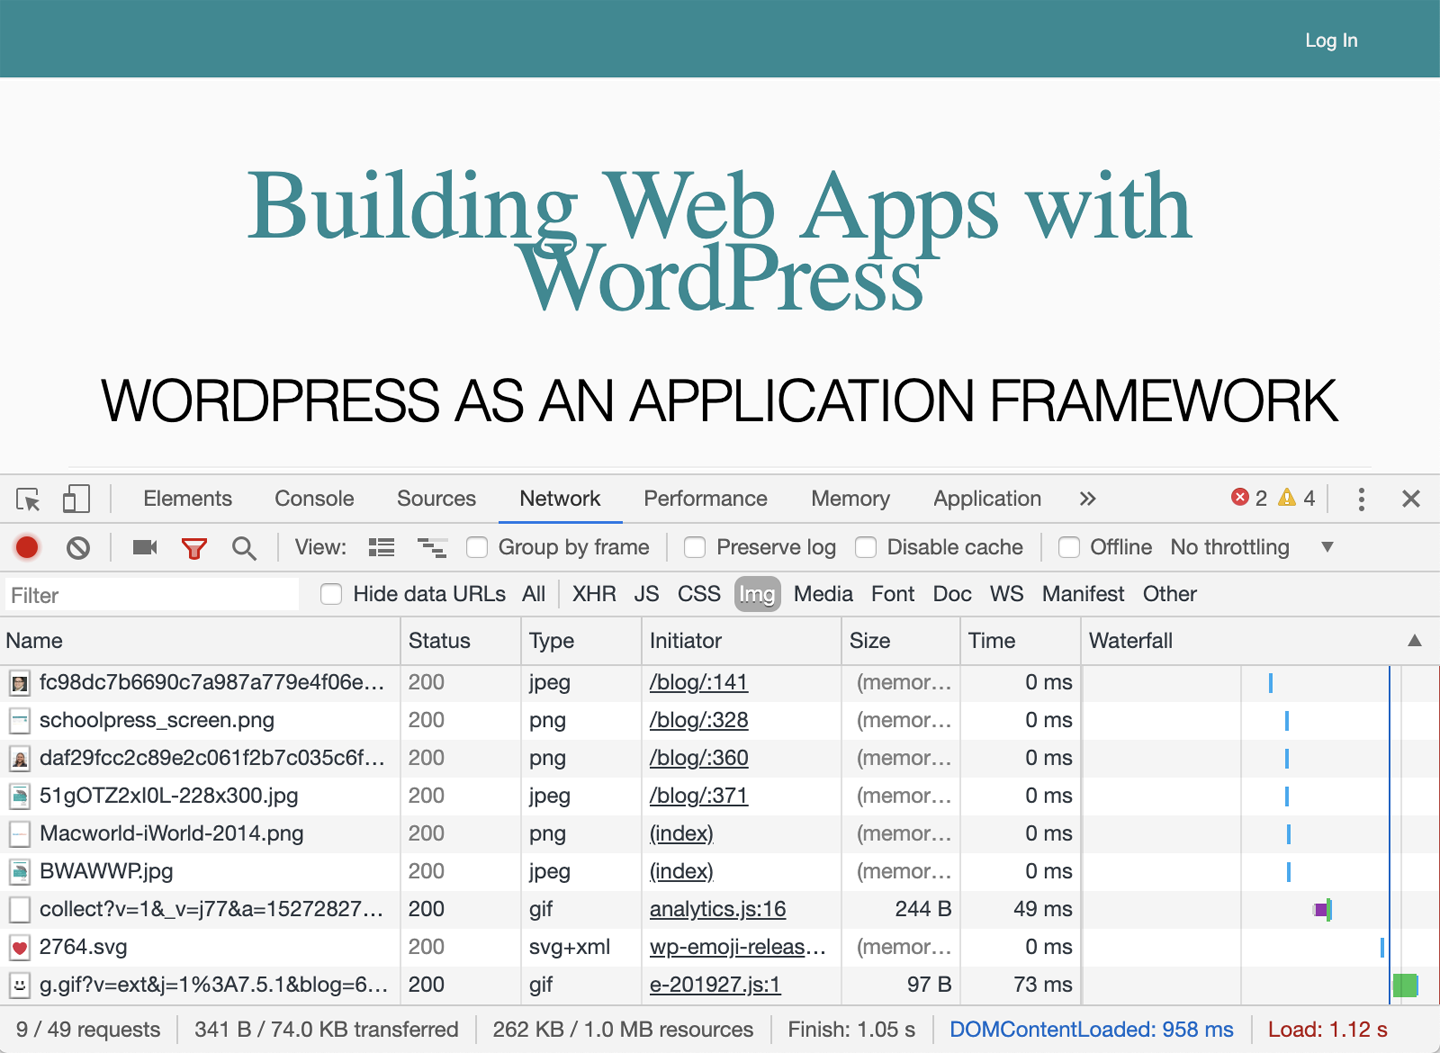
Figure 14-1. A shot of the Network tab of the Chrome Debug Bar
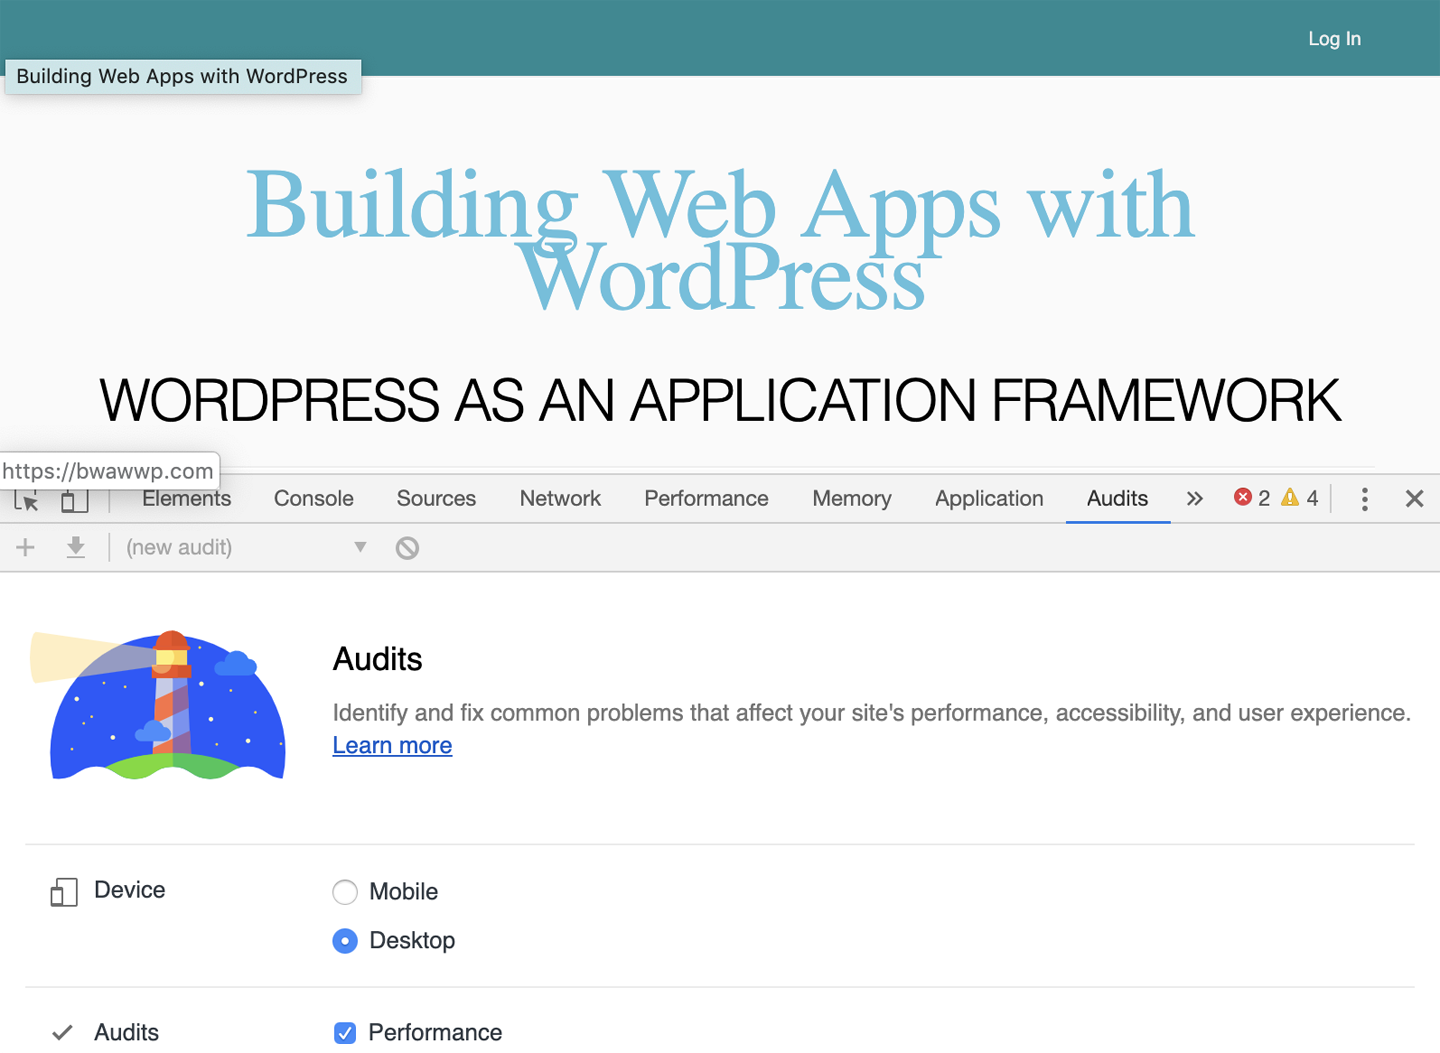
Figure 14-2. The Audit tab of the Chrome Debug Bar
The WordPress Site Health Tool
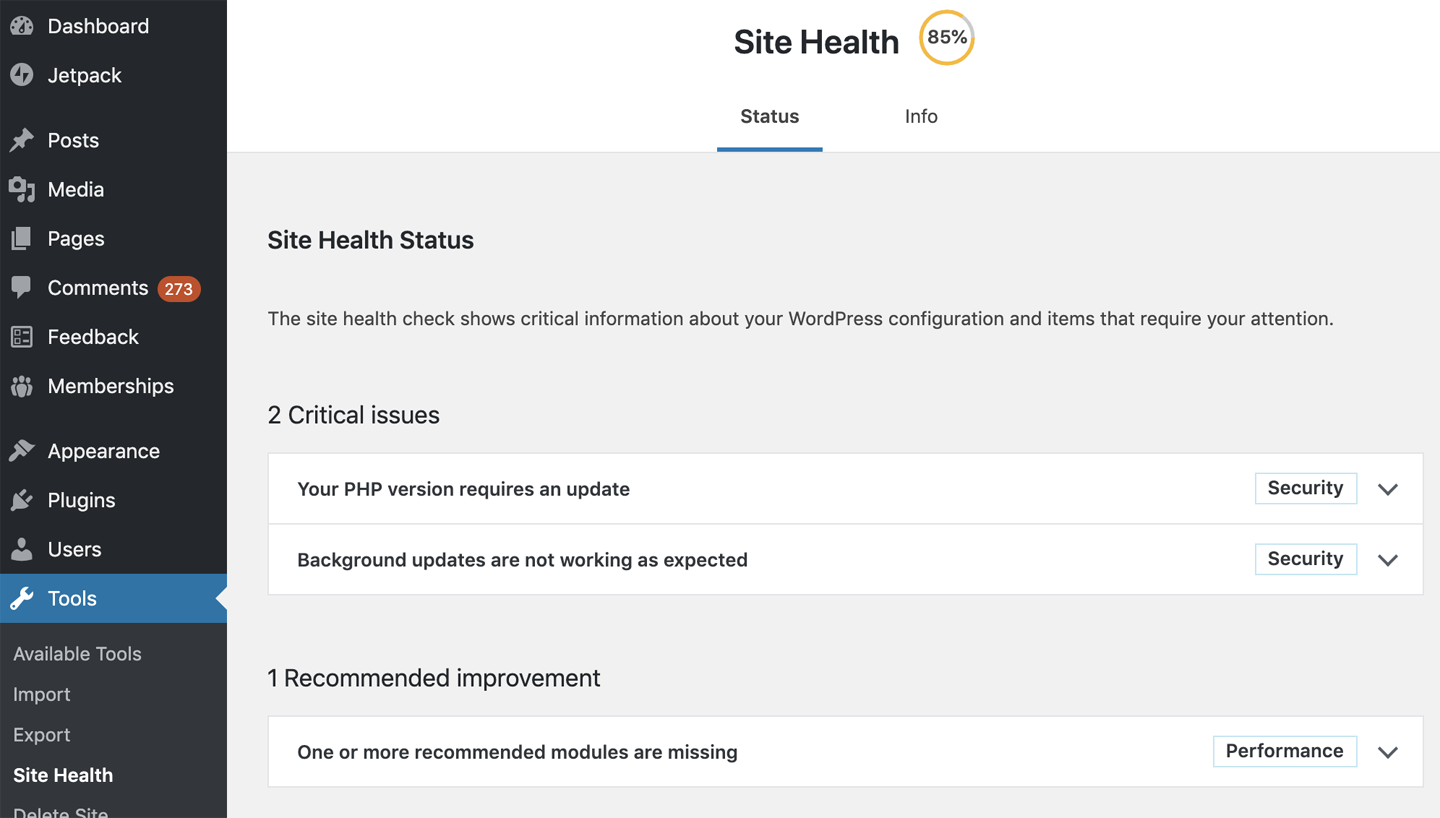
Figure 14-3. The WordPress Site Health Tool
Apache Bench
Installing Apache Bench
yum install httpd-tool
apt-get install apache2-util
Running Apache Bench
ab -n 1000 -c 100 http://yourdomain.com/index.php
Note
#ab -n 1000 -c 100 http://yourdomain.com/index.php
This is ApacheBench, Version 2.3 <$Revision: 655654 $>
Copyright 1996 Adam Twiss, Zeus Technology Ltd, http://www.zeustech.net/
Licensed to The Apache Software Foundation, http://www.apache.org/

Benchmarking yourdomain.com (be patient)


Server Software:        Apache/2.2.15
Server Hostname:        yourdomain.com
Server Port:            80

Document Path:          /
Document Length:        251 bytes

Concurrency Level:      100
Time taken for tests:   8.167 seconds
Complete requests:      1000
Failed requests:        993
   (Connect: 0, Receive: 0, Length: 993, Exceptions: 0)
Write errors:           0
Non-2xx responses:      7
Total transferred:      9738397 bytes
HTML transferred:       9516683 bytes
Requests per second:    122.44 [#/sec] (mean)
Time per request:       816.740 [ms] (mean)
Time per request:       8.167 [ms] (mean, across all concurrent requests)
Transfer rate:          1164.40 [Kbytes/sec] received

Connection Times (ms)
              min  mean[+/-sd] median   max
Connect:        0    0   0.4      0       2
Processing:     3  799 127.4    826    1164
Waiting:        2  714 113.7    729    1091
Total:          3  799 127.4    826    1164

Percentage of the requests served within a certain time (ms)
  50%    826
  66%    854
  75%    867
  80%    876
  90%    904
  95%    936
  98%    968
  99%    987
100% 1164 (longest request)Testing with Apache Bench
Run Apache Bench from somewhere other than the server you are testing, since Apache Bench itself will be using resources required for your web server to run. Running your benchmarks from outside locations will also give you a more realistic idea of page generation times, including network transfer times.
On the other hand, running Apache Bench from the same server the site is hosted on removes the network latency from the equation and gives you a window into the performance of your stack irrespective of the greater internet.
Start with a small number of simultaneous connections and build up to larger numbers. If you test 100,000 simultaneous connections right out of the gate, you can fry your web server or your testing server, or both. Start with 100 connections, then 200, then 500, then 1,000, adding more as you go. Large errors or bottlenecks in your server and app performance can appear with as few as 100 connections. Once you pass those tests, try throwing more connections at the app.
Run multiple tests. Many factors will affect the results of your benchmarks. No two tests will be exactly the same, so run a few tests on different pages of your site, at different times, under different conditions, and from different servers and geographical locations. This will give you more realistic results.
Graphing Apache Bench results with gnuplot
Note
# mkdir benchmarks
# mkdir benchmarks/data
# mkdir benchmarks/graphs
# ab -n 5000 -c 200 -g benchmarks/data/testing.tsv “http://yourdomain.com/”
Requests per second:    95.00 [#/sec] (mean)
Time per request:       2105.187 [ms] (mean)
# Let's output to a png filesetterminalpngsize1024,768# This sets the aspect ratio of the graphsetsize1,1# The file we'll write tosetoutput"graphs/sequence.png"# The graph titlesettitle"Benchmark testing"# Where to place the legend/keysetkeylefttop# Draw gridlines oriented on the y-axissetgridy# Label the x-axissetxlabel'requests'# Label the y-axissetylabel"response time (ms)"# Tell gnuplot to use tabs as the delimiter instead of spaces (default)setdatafileseparator'\t'# Plot the dataplot"data/testing.tsv"every::2using5title'response time'withlinesexit
# Let's output to a png filesetterminalpngsize1024,768# This sets the aspect ratio of the graphsetsize1,1# The file we'll write tosetoutput"graphs/timeseries.png"# The graph titlesettitle"Benchmark testing"# Where to place the legend/keysetkeylefttop# Draw gridlines oriented on the y axissetgridy# Specify that the x-series data is time datasetxdatatime# Specify the *input* format of the time datasettimefmt"%s"# Specify the *output* format for the x-axis tick labelssetformatx"%S"# Label the x-axissetxlabel'seconds'# Label the y-axissetylabel"response time (ms)"# Tell gnuplot to use tabs as the delimiter instead of spaces (default)setdatafileseparator'\t'# Plot the dataplot"data/testing.tsv"every::2using2:5title'response time'withpointsexit
# cd benchmark
# gnuplot plot1.gp
# gnuplot plot2.gp
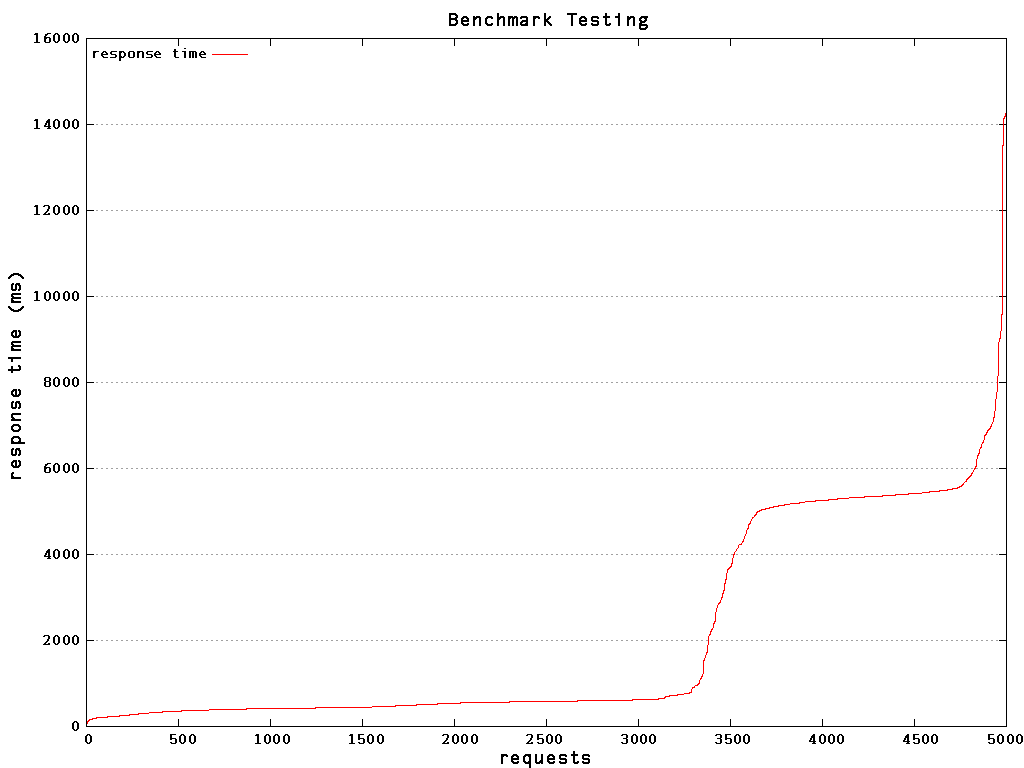
Figure 14-4. The output of the plot1.gp gnuplot script
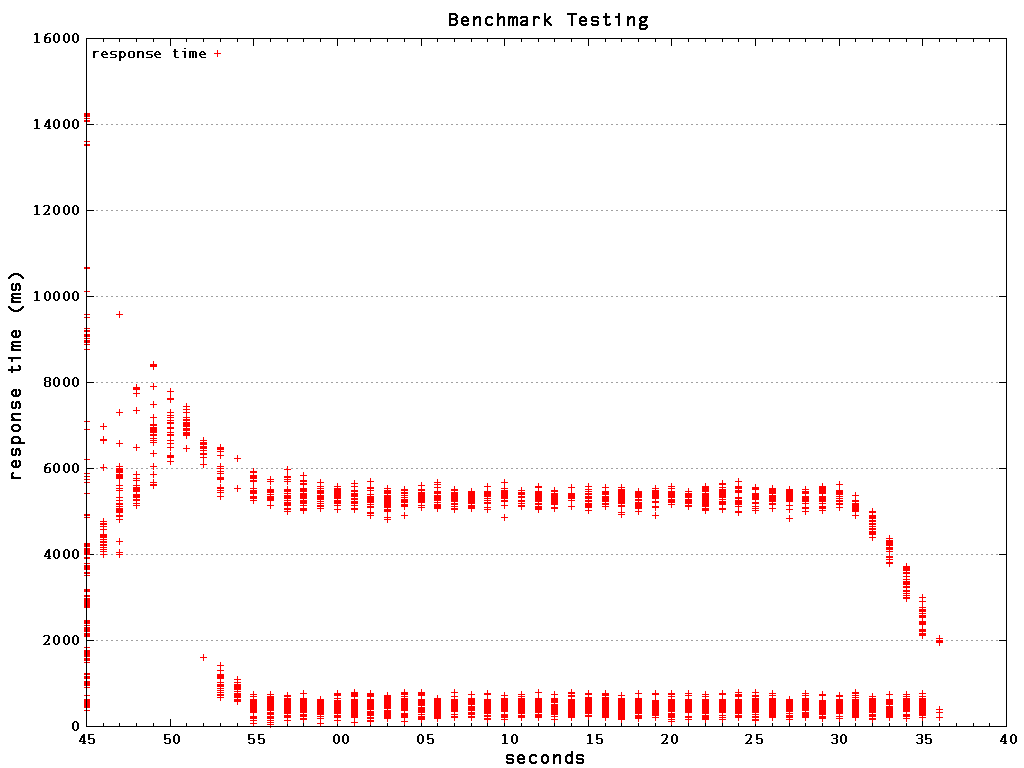
Figure 14-5. The output of the plot2.gp gnuplot script
Siege
siege -b -c100 -d20 -t2M http://yourdomain.com
** Preparing 100 concurrent users for battle.
The server is now under siege...
Lifting the server siege...      done.

Transactions:    	        1160 hits
Availability:		      100.00 %
Elapsed time:		      119.29 secs
Data transferred:	        9.53 MB
Response time:		        0.11 secs
Transaction rate:	        9.72 trans/sec
Throughput:		        0.08 MB/sec
Concurrency:		        1.05
Successful transactions:        1160
Failed transactions:	           0
Longest transaction:	        0.26
Shortest transaction:	        0.09
W3 Total Cache
Mileage varies, but one thing we know for certain is that user experience sits right next to content in terms of importance—they go hand in hand. In order for a site or app to actually reach its potential, it’s critical that the stack, app and browser are all working in harmony. For WordPress, I try to make that easier than it was in the past with W3 Total Cache.
Note
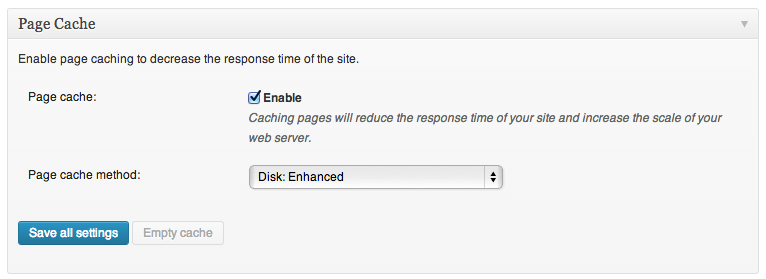
Figure 14-6. Check Enable in the box for each performance technique you want to use
Page Cache Settings
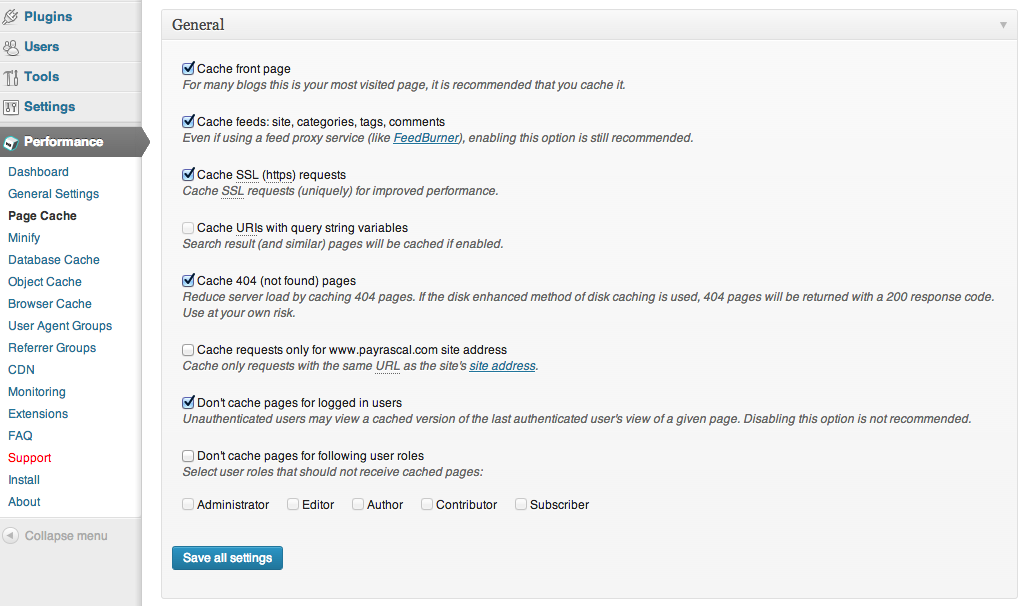
Figure 14-7. W3 Total Cache page cache general settings
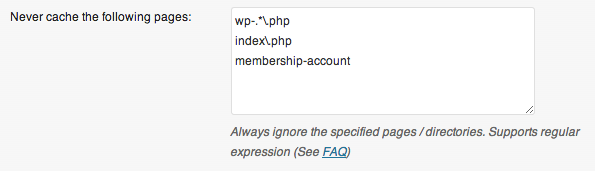
Figure 14-8. “Never cache the following pages” section in W3 Total Cache Page settings
Minify
Database Caching
Object Cache
CDNs
GZIP Compression
Hosting
WordPress-Specific Hosts
Rolling Your Own Server
Warning
Apache server setup
Disable unnecessary modules loaded by default.
Set up Apache to use prefork or worker multiprocessing, depending on your need. A good overview of each option can be found in the blog post “Understanding Apache 2 MPM (worker vs prefork)”. Prefork (the default) is usually best for running WordPress.
If using the Apache Prefork Multi-Processing Module (default), configure the
StartServers,MinSpareServers,MaxSpareServers,ServerLimit,MaxClients, andMaxRequestsPerChildvalues.If using the worker Multi-Processing Module, configure the
StartServers,MaxClients,MinSpareThreads,MaxSpareThreads,ThreadsPerChild, andMaxRequestsPerChildvalues.
MaxClientsWhen Apache is processing a request to serve a file or PHP script, the server creates a child process to handle that request. The
MaxClientssetting in your Apache configuration tells Apache the maximum number of child processes to create.After reaching the
MaxClientsnumber, Apache will queue up other incoming requests. So ifMaxClientsis set too low, your visitors will experience long load times as they wait for Apache to even start to process their requests.If
MaxClientsis set too high, Apache will use up all of your RAM and start to useswap memory, which is stored on the hard drive and much, much slower than physical RAM. When this happens, your visitors will experience long load times since their requests will be handled using the slower swap memory.Besides simply being slower, swap memory also requires more CPU as the memory is swapped from hard disks to RAM and back again, which can lead to lower performance overall. When your server backs up like this, it’s called
thrashingand can quickly spiral out of control and eventually will lock up your server.So it’s important to pick a good value for your MaxClients setting. To determine an appropriate value for MaxClients for your Apache server, take the amount of server memory you want to dedicate to Apache (typically as much as possible after you subtract the amount that MySQL and any other services on your server use) and then divide that by the average memory footprint of your Apache processes.
There is no exact way to figure out how much memory your services are using or how much memory each Apache process takes. It’s best to start conservatively and to tweak the values as you watch in real time.
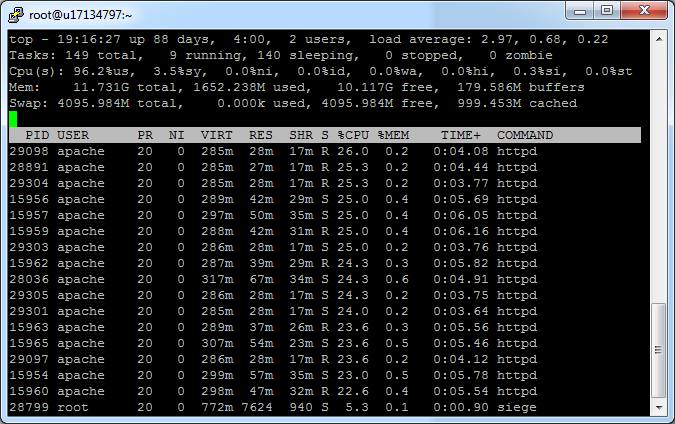
Using the command
top -Mwe can see the total memory on our server, how much is free, and how much active processes are currently using. On our test server, which is under no load, you can see that we have 11.7 GB of memory and 10.25 GB of that free. If we want to do a 50/50 split between Apache and MySQL (another assumption you should test out and adjust to your specific app), we can dedicate about 4.5 GB to Apache, dedicate 4.5 GB to MySQL, and leave the rest (up to 2.7 GB in this case) for padding and other services running on the server.Figure 14-9 shows an example of the output from running the
topcommand. To figure out how much memory Apache needs for each process, usetop -Magain, when the server is under normal loads. Look for processes running thehttpdcommand. If we see our app using about 20 MB of memory for each process, we would divide 4.5 GB (~4600 MB) by 20 MB and get 230, meaning our server should be able to support 230MaxClientsin 4.5 GB of memory.When setting the
MaxClientsvalue, set theServerLimitvalue to the same number. ServerLimit is a kind ofMaxClientsthat can only be changed when Apache is restarted. TheMaxClientssetting can be changed by other scripts while Apache is running, although this isn’t commonly done. So theoreticallyServerLimitcould be set higher thanMaxClientsand some process could increase or decrease theMaxClientsvalue while Apache is running.
Figure 14-9. Using the top command to figure out how much memory is available
MaxRequestsPerChildEach child process or client spun up by Apache will handle multiple requests one after another. If
MaxRequestsPerChildis set to 0, these child processes are never shut down, which is good since it lowers the overhead of spinning up a new child process, but can be bad if there is a memory leak in your app. SettingMaxRequestsPerChildto a very high number like 1,000 or 2,000 is a nice compromise so that new processes aren’t shut down and restarted too often, but if a memory leak does occur it will be cleaned up when the child process is eventually shut down.KeepAliveBy default, the
KeepAlivesetting of Apache is turned off, meaning that after serving a file to a client browser, the connection is closed. A separate connection is opened and closed for each file request from that browser. Since a single page may have several files associated with it (in the form of images, JavaScript, and CSS), this can lead to a lot of unnecessary opening and closing of connections.With
KeepAliveturned on, Apache will keep the first connection from a web browser open and serve all subsequent requests from the same browser session through that connection. After sitting idle with no requests from the same browser session, Apache will close the connection. Using a single connection instead of many can lead to great performance gains for some sites, especially if there are a lot of images or separate CSS and JavaScript on each page (you should probably be minimizing your CSS and JavaScript into one file for each anyway).On the other hand, turning
KeepAliveon requires more RAM since each connection will hold on to the memory for each request as it keeps a connection open.It’s useful to experiment with turning
KeepAliveon. If you do, you should change theKeepAliveTimeoutvalue from the default 15 seconds to something smaller like 2 or 3 seconds—or something closer to the real load times of a single page visit on your site. This will free up the memory faster.Also, if you turn
KeepAliveon, you should probably adjust theMaxClientsandMaxRequestsPerChildsettings. Since each child process will be using more memory as it keeps the connection open, you may need to decrease yourMaxClientsvalue to avoid running out of memory. And since each connection counts as one request with respect toMaxRequestsPerChild, you may want to decrease yourMaxRequestsPerChildvalue since there will be fewer requests overall per visit.
Nginx in front of Apache
MySQL optimization
- Optimizing MySQL configuration
The MySQL configuration file is typically found at /etc/my.cnf or /etc/mysql/my.cnf and can be tweaked to improve performance on your site. There are several interelated settings. The best way to figure out a good configuration for your hardware and site is to use the MySQLTuner Perl script.
After downloading the MySQLTuner script, you will also need to have Perl installed on your server. Then run
perl mysqltuner.pland follow the recommendations given. The output will look like the following:-------- General Statistics --------------------------------------------- [--] Skipped version check for MySQLTuner script [OK] Currently running supported MySQL version 5.5.32 [OK] Operating on 64-bit architecture -------- Storage Engine Statistics -------------------------------------- [--] Status: +Archive -BDB -Federated +InnoDB -ISAM -NDBCluster [--] Data in MyISAM tables: 35M (Tables: 395) [--] Data in InnoDB tables: 16M (Tables: 316) [--] Data in PERFORMANCE_SCHEMA tables: 0B (Tables: 17) [!!] Total fragmented tables: 327 -------- Security Recommendations -------------------------------------- [OK] All database users have passwords assigned -------- Performance Metrics -------------------------------------------- [--] Up for: 26d 22h 6m 21s (8M q [3.755 qps], 393K conn, TX: 15B, RX: 1B) [--] Reads / Writes: 95% / 5% [--] Total buffers: 168.0M global + 2.8M per thread (151 max threads) [OK] Maximum possible memory usage: 583.2M (7% of installed RAM) [OK] Slow queries: 0% (0/8M) [OK] Highest usage of available connections: 21% (33/151) [OK] Key buffer size / total MyISAM indexes: 8.0M/21.1M [OK] Key buffer hit rate: 100.0% (84M cached / 40K reads) [!!] Query cache is disabled [OK] Sorts requiring temporary tables: 0% (3 temp sorts / 1M sorts) [!!] Joins performed without indexes: 23544 [!!] Temporary tables created on disk: 26% (359K on disk / 1M total) [!!] Thread cache is disabled [OK] Table cache hit rate: 34% (400 open / 1K opened) [OK] Open file limit used: 68% (697/1K) [OK] Table locks acquired immediately: 99% (8M immediate / 8M locks) [OK] InnoDB data size / buffer pool: 16.1M/128.0M -------- Recommendations ------------------------------------------------ General recommendations: Run OPTIMIZE TABLE to defragment tables for better performance Enable the slow query log to troubleshoot bad queries Adjust your join queries to always utilize indexes When making adjustments, make tmp_table_size/max_heap_table_size equal Reduce your SELECT DISTINCT queries without LIMIT clauses Set thread_cache_size to 4 as a starting value Variables to adjust: query_cache_size (>= 8M) join_buffer_size (> 128.0K, or always use indexes with joins) tmp_table_size (> 16M) max_heap_table_size (> 16M) thread_cache_size (start at 4)One thing to note is that MySQLTuner will give better recommendations if it has at least one day’s worth of log data to process. For this reason, it should be run 24 hours after MySQL has been restarted. You’ll want to follow the recommendations given, wait 24 hours, and run the script again, then rinse and repeat over a few days to narrow in on optimal settings for your MySQL setup.
- Optimizing database queries
A large source of load-time-draining process cycles is unoptimized, unnecessary, or otherwise slow MySQL queries. Finding and optimizing these slow SQL queries will speed up your site. Caching database queries, either at the database level or through the use of transients for specific queries, will help with slow queries, but you definitely want the original SQL as optimized as possible.
The first step in optimizing your database queries is to find out which queries are slow or otherwise undeeded. A great tool to do this is the Query Monitor plugin by John Blackbourn.
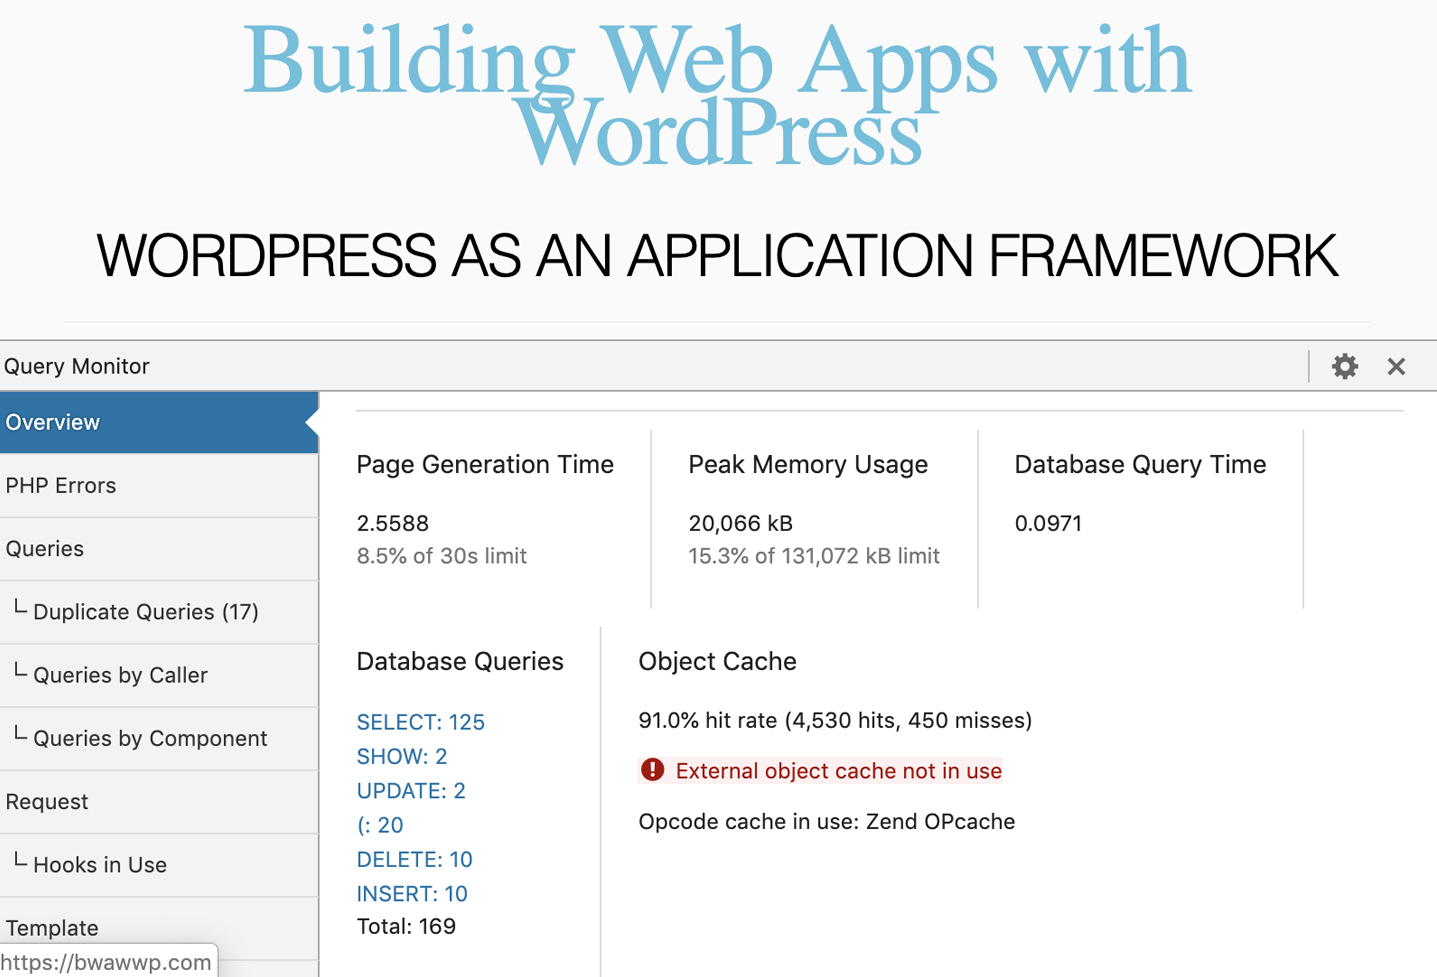
Figure 14-10. The Query Monitor added to the bottom of all pages on your site while active
Note
slow-query-log = 1;
slow-query-log-file = /path/to/a/log/file;
Cases where the same SQL query is being run more than once per page load. Store the result in a global variable or somewhere else to access it later in the page load.
Cases where one SQL query can be used instead of many queries. For example, plugins can load all their options at once instead of using a separate query or a
getOption()call for each option.Cases where a SQL query is being run, but the result is not being used. Some queries may only need to be run in the dashboard or only on the frontend or only on a specific page. Change the WordPress hook being used or add PHP logic around these calls so they are only executed when needed.
Adjust queries to use only indexed columns in
WHERE,ON,ORDER BY, andGROUP BYclauses.Add
WHEREclauses to yourJOINs so you are joining smaller subtables.Use a different table to store your data—for example, using taxonomies versus post meta (covered in This Post).
Add indexes to columns that are to be used in
WHERE,ON,ORDER BY, andGROUP BYclauses.
advanced-cache.php and object-cache.php
Alternative PHP Cache (APC)
- Opcode caching
When a PHP script is executed, it is compiled to opcodes that are ready to be executed by the server. With an opcode cache, part of the compiling is cached until the underlying PHP scripts are updated.
- Key-value cache
APC also adds the
apc_store()andapc_fetch()functions, which can be used to store and retrieve bits of information from memory. A value stored in memory can typically be loaded faster than a value stored on a hard disk or in a database, especially if that value requires some computation. Plugins like W3 Total Cache or APC Object Cache Backend can be used to store the WordPress object cache inside of RAM using APC.
Install APC on your server, configure PHP to use it, and restart your web server.
Configure WordPress to use APC using W3 Total Cache, APC Object Cache Backend, or another plugin or custom object-cache.php script.
Note
Memcached
Install the Memcached service on your server, give it some memory, and run it.
Use W3 Total Cache or the Memcached Object Cache plugin to update the WordPress object cache to use Memcached.
Redis
Install Redis on your server, give it some memory, and run it.
Use a replacement for the WordPress index.php that searches the Redis cache and serves pages from there if found. A popular version is wp-redis-cache.
Run a plugin or other script to clear the Redis cache on, for example, post updates.
Varnish
Install Varnish on your server.
Configure Varnish to ignore the dashboard at /wp-admin/ and other sections of your site that shouldn’t be cached.
Use a plugin to purge the Varnish cache when posts are updated and other updates are done to WordPress. Some popular plugins to do this are WP-Varnish and Varnish HTTP Purge.
Batcache
Set up Memcached or APC to be used as Batcache’s in-memory key-value store.
Download the Batcache plugin from the WordPress repository.
Move the advanced-cache.php file to the wp-content folder of your WordPress install.
Selective Caching
Note
The Transient API
Example 14-1. SPClass
classSPClass(){/* ... constructor and other methods ... */functiongetStudents(){/* gets all users within the BuddyPress group for this class */return$this->students;//array of student objects}functiongetAssignmentAverages(){//check for transient$this->assignment_averages=get_transient('class_assignment_averages_'.$this->ID);//no transient found? compute the averagesif(empty($this->assignment_averages)){$this->assignment_averages=array();$this->getStudents();foreach($this->studentsas$student){$this->assignment_averages[$student->ID]=$student->getAssignmentAverages();}//save in transientset_transient('class_assignment_averages_'.$this->ID,$this->assignment_averages);}//return the averagesreturn$this->assignment_averages;}}//clear assignment averages transients when an assignment is gradedpublicfunctionclear_assignment_averages_transient($assignment_id){//class id is stored as postmeta on the assignment post$assignment=newAssignment($assignment_id);$class_id=$assignment->class_id;//clear any assignment averages transient for this classdelete_transient('class_assignment_averages_'.$class_id);}add_action('sp_update_assignment_score',array('SPClass','clear_assignment_averages_transient'));
$transientUnique name for the transient, 45 characters or fewer.
$valueThe value to store. Objects and arrays are automatically serialized and unserialized for you.
$expirationAn optional parameter to set an expiration for the transient in seconds. Expired transients are deleted by a WordPress garbage collection script. By default, this value is
0and doesn’t expire until deleted.
Note
Multisite Transients
set_site_transient( $transient, $value, $expiration )get_site_transient( $transient )delete_site_transient( $transient )
Using JavaScript to Increase Performance
Note
Example 14-2. JS Display Name plugin
<?php/*Plugin Name: JS Display NamePlugin URI: http://bwawwp.com/js-display-name/Description: A way to load the display name of a logged-in user through JSVersion: .1Author: Jason ColemanAuthor URI: http://bwawwp.com*//*use this function to place the JavaScript in your themeif(function_exists("jsdn_show_display_name")){jsdn_show_display_name();}*/functionjsdn_show_display_name($prefix="Welcome, "){?><p><script src="/<?phpechoadmin_url("/admin-ajax.php?action=jsdn_show_display_name&prefix=".urlencode($prefix));?>"></script></p><?php}/*This function detects the JavaScript call and returns the user's display name*/functionjsdn_wp_ajax(){global$current_user;if(!empty($current_user->display_name)){$prefix=sanitize_text_field($_REQUEST['prefix']);$text=$prefix.$current_user->display_name;header('Content-Type: text/javascript');?>document.write(<?phpechojson_encode($text);?>);<?php}exit;}add_action('wp_ajax_jsdn_show_display_name','jsdn_wp_ajax');add_action('wp_ajax_nopriv_jsdn_show_display_name','jsdn_wp_ajax');
Custom Tables
CREATETABLE`wp_sp_assignments`(`id`bigint(20)unsignedNOTNULLAUTO_INCREMENT,`post_id`bigint(20)unsigned,`class_id`bigint(20)unsigned,`student_id`bigint(20)unsigned,`score`int(10),`assignment_date`DATETIME,`due_date`DATETIME,`submission_date`DATETIEPRIMARYKEY(`id`),UNIQUEKEY`post_id`(`post_id`),KEY`class_id`(`class_id`),KEY`student_id`(`student_id`),KEY`score`(`score`),KEY`asignment_date`(`assignment_date`),KEY`due_date`(`due_date`),KEY`submission_date`(`submission_date`));
functionsp_update_assignments_table($post_id){//get the post$post=get_post($post_id);//we only care about assignmentsif($post->post_type!="assignment")returnfalse;//get data ready for insert or replace$assignment_data=array("post_id"=>$post_id,"student_id"=>$post->post_author,"teacher_id"=>$post->teacher_id,"score"=>$post->score,"assignment_date"=>$post->assignment_date,"due_date"=>$post->due_date"submission_date"=>$post->submission_date);//look for an existing assignment$assignment_id=$wpdb->get_var("SELECT idFROM wp_sp_assignmentsWHERE post_id = '".$post_id."'LIMIT 1");//if no assignment id, this is a new assignmentif(empty($assignment_id)){$assignment_id=$wpdb->insert("wp_sp_assignments",$assignment_data);}else{$assignment_data['id']=$assignment_id;$wpdb->replace("wp_sp_assignments",$assignment_data);}return$assignment_id;}add_action('save_post','sp_update_assignments_table');
Bypassing WordPress
1 Pun intended.
2 Run yum install gnuplot on CENTOS/Redhat systems. More information can be found at the gnuplot home page.
3 We suppose there can only be one keystone. You’ll have to forgive us this time.